In addition to user alerts, Log Insight also offers system notifications through configured email addresses. I would like to discuss the different types of system notifications available today and how you can troubleshoot potential issues Log Insight notifies you about.

Configuration
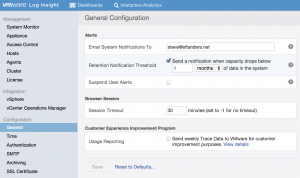
System notifications are configured under Administration > General:

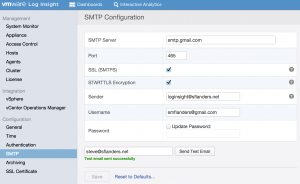
Since system notifications are sent via email, it is important to properly configure and test the SMTP settings as well to ensure notifications will be received:

Types
Log Insight send two different types of system notifications:
- System alerts
- Critical issues that need immediate attention
- Warnings that may require attention
- Informational alerts
- Normal activity to be aware of
All system notification are defined in the official documentation:
- Critical alerts
- Dropped events
- Corrupt index buckets
- Out of disk
- Total disk space changed
- License is expired
- Warning alerts
- Archive space will be full
- Archive failure
- Pending archives
- License is about to expire
- Information alerts
- Oldest data will be unsearchable soon
- Repository retention time
Location
As mentioned earlier, system notifications are primarily sent to the configured email address(es), but may also appear in the UI as a red exclamation mark for situations such as when email cannot be sent properly:

Resolving Issues
Sometimes the system notification does not provide enough information to determine if the issue is continuing and what needs to be done to resolve the problem. If this occurs, the logs on the Log Insight virtual appliance can be analyzed. I would like to walk through a couple of common examples.
vCenter collection
When Log Insight is unable to collect vCenter events, tasks, and alarms, the following system notification is sent:
This alert is about your Log Insight installation on li.sflanders.net
vCenter collection failed triggered at 2014-09-19T06:54:40.878Z
vCenter task and event collection failed for the following host:
vcs01.matrix
This message was generated by your Log Insight installation, visit the Documentation Center for more information.
To look for the exact error that caused the collection failure and to see if the collection is working currently, look in the /storage/var/loginsight/plugins/vsphere/li-vsphere.log file:
# tail li-vsphere.log
[2014-10-01 01:45:10.024+0000] [main/127.0.0.1 INFO] [com.vmware.loginsight.vsphere.events.VimEventMonitor] [fetch events created since the last event at 2014-10-01 01:43:08.919]
[2014-10-01 01:45:10.045+0000] [main/127.0.0.1 INFO] [com.vmware.loginsight.vsphere.events.VimEventMonitor] [fetched 26 events in total]
[2014-10-01 01:45:10.046+0000] [main/127.0.0.1 INFO] [com.vmware.loginsight.vsphere.events.VimEventMonitor] [1 duplicate message(s) dropped]
[2014-10-01 01:45:10.057+0000] [main/127.0.0.1 INFO] [com.vmware.loginsight.vsphere.events.VimEventMonitor] [Sending 25 messages to be indexed.]
[2014-10-01 01:45:10.304+0000] [main/127.0.0.1 INFO] [com.vmware.loginsight.vsphere.events.VimEventMonitor] [disconnected from vCenter at https://vcs01.matrix/sdk]
[2014-10-01 01:47:10.939+0000] [main/127.0.0.1 INFO] [com.vmware.loginsight.vsphere.events.VimEventMonitor] [connected to vCenter at https://vcs01.matrix/sdk]
[2014-10-01 01:47:18.894+0000] [main/127.0.0.1 INFO] [com.vmware.loginsight.vsphere.events.VimEventMonitor] [fetch events created since the last event at 2014-10-01 01:45:17.812]
[2014-10-01 01:47:18.926+0000] [main/127.0.0.1 INFO] [com.vmware.loginsight.vsphere.events.VimEventMonitor] [fetched 38 events in total]
[2014-10-01 01:47:18.943+0000] [main/127.0.0.1 INFO] [com.vmware.loginsight.vsphere.events.VimEventMonitor] [Sending 38 messages to be indexed.]
[2014-10-01 01:47:19.213+0000] [main/127.0.0.1 INFO] [com.vmware.loginsight.vsphere.events.VimEventMonitor] [disconnected from vCenter at https://vcs01.matrix/sdk]
OK, looks like it is working now, so let’s see why it failed:
# grep -iv info li-vsphere.log
[2014-09-19T06:54:40.878Z] [main/127.0.0.1 WARN ] [com.vmware.loginsight.vsphere.events.VimEventMonitor] [Could not resolve hostname:vcs01.matrix]
[2014-09-19T06:54:47.690Z] [main/127.0.0.1 ERROR ] [com.vmware.loginsight.vsphere.events.VimEventMonitor] [Failed to Monitor VimEvents]
Looks like a temporary DNS issue.
Archiving failure
When Log Insight is unable to archive, the following system notification is sent:
This alert is about your Log Insight installation on li.sflanders.net
Archive Failure triggered at 2014-09-03T15:25:59.686Z
Action is required. Log Insight failed to connect to the archive storage: nfs://nfs.matrix/data/archive. Data might not be able to archive. This could indicate that the archiving destination is unavailable or having performance issues. If this problem is not resolved, the disk on your Log Insight installation will fill up and stop accepting data. Other unexpected issues may also occur. Please check the status of the archive destination.
Troubleshooting tips:
1. Is your NFS server reachable by Log Insight?
2. Is there sufficient space available?
3. Have permissions been properly configured to allow Log Insight to write and access the NFS server?
4. Is there sufficient end-to-end NFS throughput between the Log Insight appliance and the NFS server?
This message was generated by your Log Insight installation, visit the Documentation Center for more information.
To look for the exact error that caused the archive failure and to see if archiving is working currently, look in the /storage/var/loginsight/runtime.log file:
# grep com.vmware.loginsight.commons.FileUtils runtime.log | tail -n 5
[2014-09-03 17:58:43.710+0000] [HealthCollectorScheduler-thread-1/127.0.0.1 ERROR] [com.vmware.loginsight.commons.FileUtils] [Failed to run 'mount nfs.matrix:/data/archive /tmp/archive-monitor5226129996904611722' exitCode=32 stdout='' stderr='mount.nfs: access denied by server while mountingnfs.matrix:/data/archive]
[2014-09-03 18:00:23.267+0000] [HealthCollectorScheduler-thread-1/127.0.0.1 ERROR] [com.vmware.loginsight.commons.FileUtils] [Failed to run 'mountnfs.matrix:/data/archive /tmp/archive-monitor5893090418347044882' exitCode=32 stdout='' stderr='mount.nfs: access denied by server while mountingnfs.matrix:/data/archive]
[2014-09-03 18:03:43.735+0000] [HealthCollectorScheduler-thread-1/127.0.0.1 ERROR] [com.vmware.loginsight.commons.FileUtils] [Failed to run 'mount nfs.matrix:/data/archive /tmp/archive-monitor6011720522119248858' exitCode=32 stdout='' stderr='mount.nfs: access denied by server while mounting nfs.matrix:/data/archive]
[2014-09-03 18:05:23.295+0000] [HealthCollectorScheduler-thread-1/127.0.0.1 ERROR] [com.vmware.loginsight.commons.FileUtils] [Failed to run 'mount nfs.matrix:/data/archive /tmp/archive-monitor5394124902893144957' exitCode=32 stdout='' stderr='mount.nfs: access denied by server while mounting nfs.matrix:/data/archive]
[2014-09-03 18:06:29.300+0000] [DaemonCommands.Processor-thread-86/127.0.0.1 ERROR] [com.vmware.loginsight.commons.FileUtils] [Failed to run 'mount nfs.matrix:/data/archive /tmp/archive-monitor1679970199659798858' exitCode=32 stdout='' stderr='mount.nfs: access denied by server while mounting nfs.matrix:/data/archive]
Well, that is not good! Archiving is failing because of a permissions issue, which means some configuration change was made. Let’s address the issue and then check the logs again:
# grep com.vmware.loginsight.commons.FileUtils runtime.log | tail -n 5
[2014-09-04 02:26:03.320+0000] [DaemonCommands.Processor-thread-5525/127.0.0.1 INFO] [com.vmware.loginsight.commons.FileUtils] [Mounted nfs.matrix:/data/archive to /tmp/archive-monitor3230397563528278798]
[2014-09-04 02:27:03.879+0000] [DaemonCommands.Processor-thread-5525/127.0.0.1 INFO] [com.vmware.loginsight.commons.FileUtils] [Mounted nfs.matrix:/data/archive to /tmp/archive-monitor4477246266628864494]
[2014-09-04 02:28:03.416+0000] [DaemonCommands.Processor-thread-5525/127.0.0.1 INFO] [com.vmware.loginsight.commons.FileUtils] [Mounted nfs.matrix:/data/archive to /tmp/archive-monitor5032060380731528530]
[2014-09-04 02:29:04.028+0000] [DaemonCommands.Processor-thread-5525/127.0.0.1 INFO] [com.vmware.loginsight.commons.FileUtils] [Mounted nfs.matrix:/data/archive to /tmp/archive-monitor7795490971534714724]
[2014-09-04 02:30:03.531+0000] [DaemonCommands.Processor-thread-5525/127.0.0.1 INFO] [com.vmware.loginsight.commons.FileUtils] [Mounted nfs.matrix:/data/archive to /tmp/archive-monitor5915649741456380535]
Much better.
Summary
System notifications are critical to understanding the health of your Log Insight environment. You should ensure that system notifications are properly configured and tested prior to putting a Log Insight environment into production. To understand what a system notification means, see the Log Insight documentation. If the system notification does not provide enough information, look at the log files within the Log Insight virtual appliance.
© 2014 – 2021, Steve Flanders. All rights reserved.

This is an excellent article, came in handy when trying out vRealize Log Insight 4.5 recently. Thank you!
Hey Paul — Thanks for the comment and I am glad it helped!
Is there a reason that LI hasn’t been configured to aggregate the runtime.log file into the UI?
There is a feature request that you can vote for / comment on here: https://loginsight.ideascale.com/a/dtd/Show-log-insight-logs-in-log-insight/60021-24427
Hello Steve,
Have you seen this error before? we actually don’t have any NFS mount currently for archiving… I was trying to set one up when i ran into this error…. I checked the /tmp and noticed the date of the attempts were well before today so its strange.
Do you know if there is a KB for this error? I couldn’t find one.
[2018-03-19 00:07:23.024+0000] [“NodeLocalChecksExecutor-thread-1″/10.42.215.41 INFO] [com.vmware.loginsight.prodcheck.service.InProductionChecksService] [Attempting to run check nfs-deadlock-check]
[2018-03-19 00:07:33.065+0000] [“CheckPerformer-thread-1″/10.42.215.41 WARN] [com.vmware.loginsight.prodcheck.lib.NFSDeadlockCheck] [This NFS mount is currently blocking: /tmp/nfs-mount-test8284967757895033583]
[2018-03-19 00:07:33.065+0000] [“CheckPerformer-thread-1″/10.42.215.41 WARN] [com.vmware.loginsight.prodcheck.lib.NFSDeadlockCheck] [This NFS mount is currently blocking: /tmp/nfs-mount-test2323219691192908386]
[2018-03-19 00:07:33.065+0000] [“CheckPerformer-thread-1″/10.42.215.41 WARN] [com.vmware.loginsight.prodcheck.lib.NFSDeadlockCheck] [This NFS mount is currently blocking: /tmp/nfs-mount-test5009226944804743653]
[2018-03-19 00:07:33.065+0000] [“CheckPerformer-thread-1″/10.42.215.41 WARN] [com.vmware.loginsight.prodcheck.lib.NFSDeadlockCheck] [This NFS mount is currently blocking: /tmp/nfs-mount-test7451601863356658437]
[2018-03-19 00:07:33.065+0000] [“CheckPerformer-thread-1″/10.42.215.41 WARN] [com.vmware.loginsight.prodcheck.lib.NFSDeadlockCheck] [This NFS mount is currently blocking: /tmp/nfs-mount-test6102441302819347379]
[2018-03-19 00:07:33.065+0000] [“CheckPerformer-thread-1″/10.42.215.41 WARN] [com.vmware.loginsight.prodcheck.lib.NFSDeadlockCheck] [This NFS mount is currently blocking: /tmp/nfs-mount-test3456305024254667176]
The prodcheck is an internal health check run before upgrade to ensure the system is healthy. You may try a restart of the node as I bet that would clear up the issue.