
As you might expect, Log Intelligent offers dashboards. In this post, I will like to cover the feature. Read on to learn more!
Background
It is much easier to consume visualizations of event data, at least initially. A dashboard makes it easy to understand multiple different things about events simultaneously as you can have multiple visualizations on the same page. Today, Log Intelligence offers a few different types of dashboarding:
- Chart on Explore page — basically a dashboard with a single widget
- Pinboard — basically a dashboard with one or more widgets that is user+browser specific and not persisted
- Dynamic dashboard — either pinboard compare of non “logs where” query from the Home page; basically an overtime dashboard with one or more widgets that is user-specific and not persisted
- Dashboard page — one or more cards (i.e., widgets) that are shared within an organization and persisted
This post will focus primarily on the Dashboard page.
Dashboard
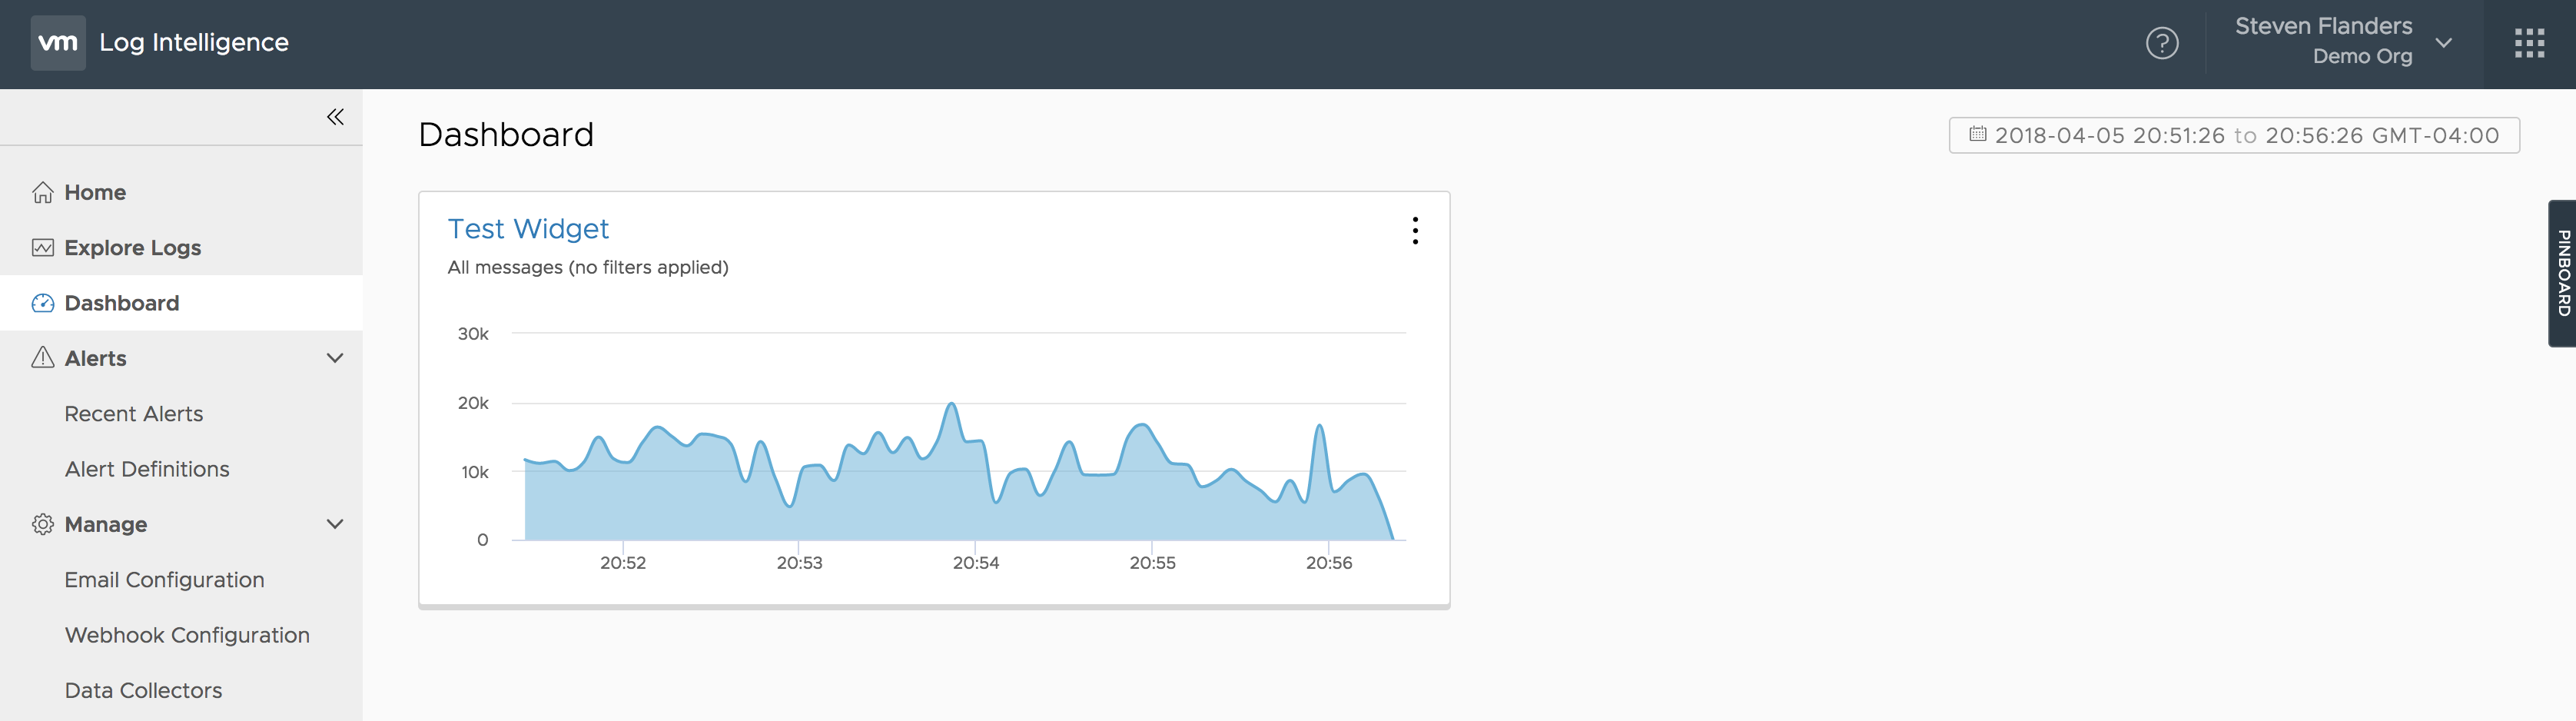
If you go to the Dashboard page by default (i.e., without saving anything to it), you will see the following:
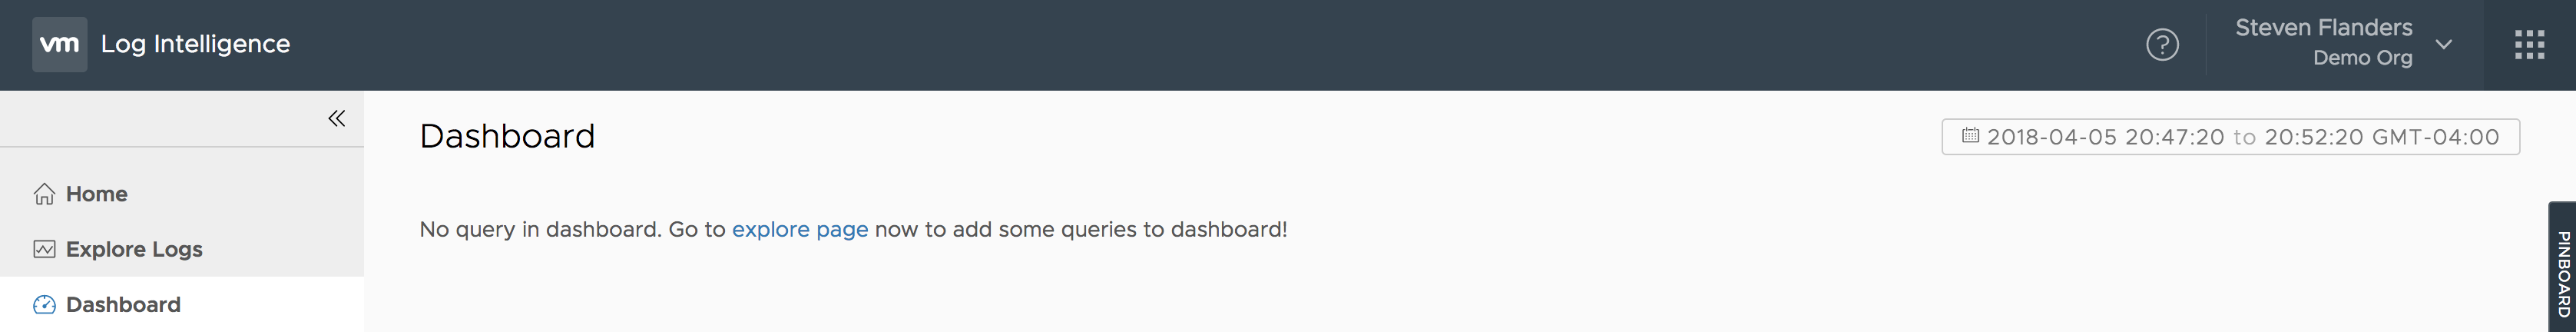
A few things you may notice immediately:
- There is a single Dashboard page, and it is organization-specific (think Shared Dashboard from Log Insight)
- Dashboard cards are added from the Explore page (just like in Log Insight)
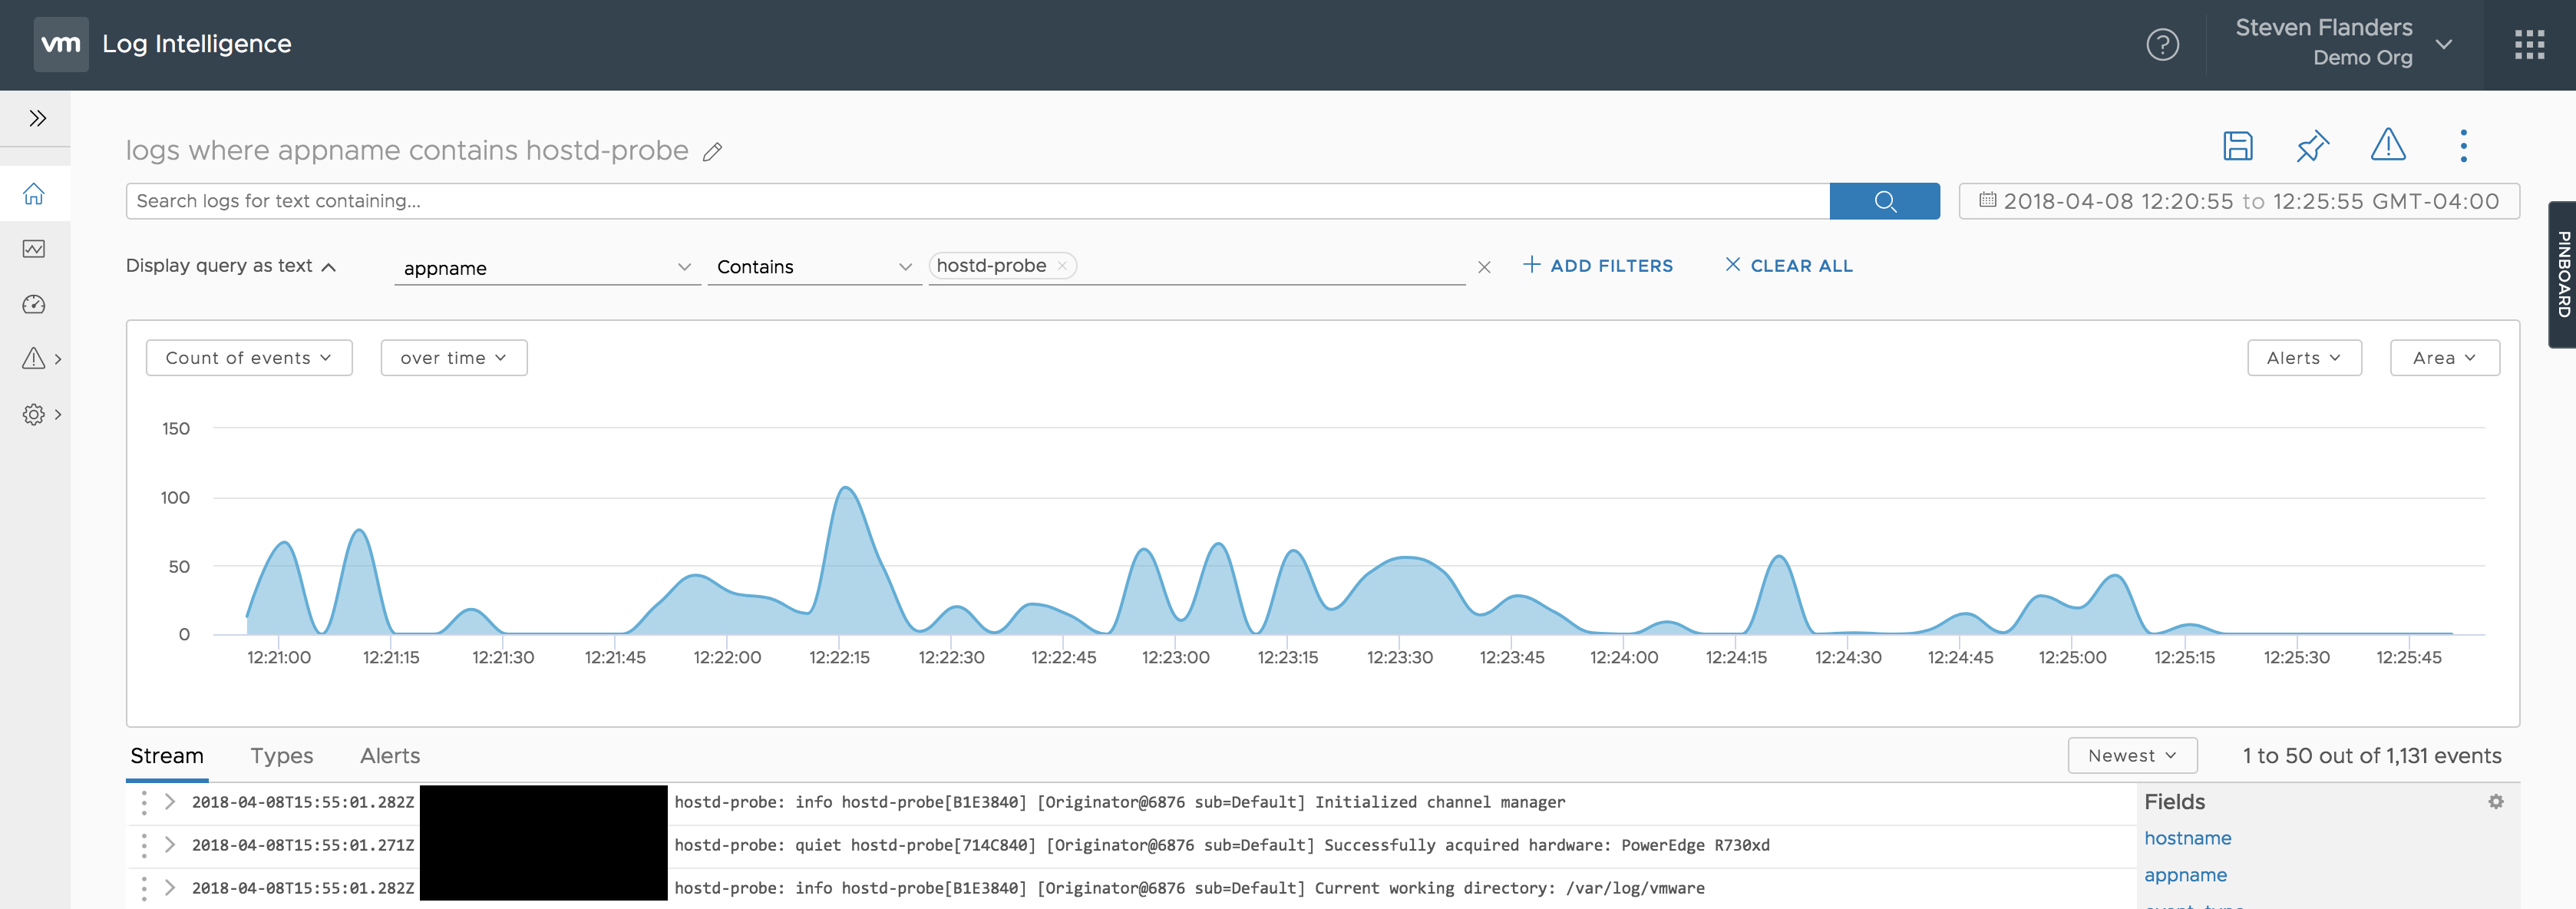
From the Explore page, it may not be immediately apparent how to add a query to the Dashboard:
To add a query to the Dashboard, you have a few options:
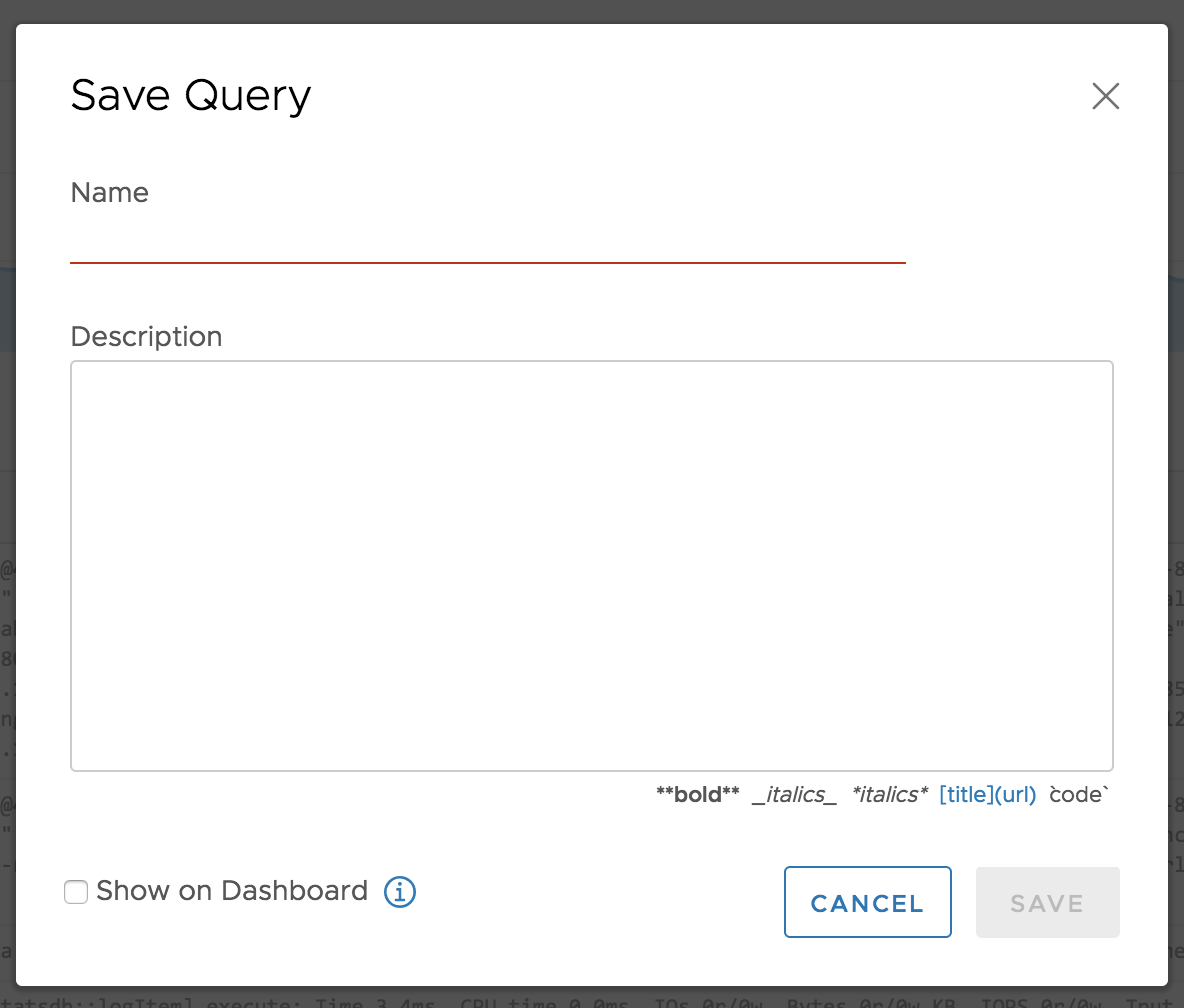
- Construct, run, and save a query — as part of the save operation, you have an option to add to the dashboard
- From the other options drop-down, select Add to Dashboard — this starts a save operation
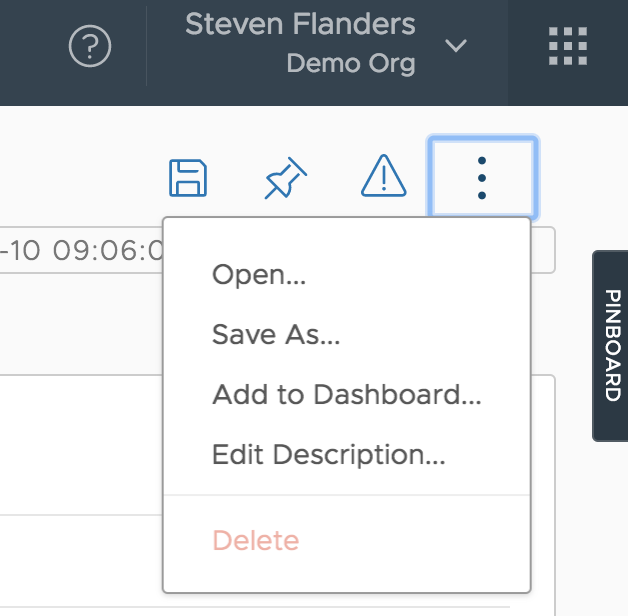
- Open a saved query (from the Open option in #2 above) and then follow step #2 to Add to Dashboard — this will update the saved query without opening the save dialog
Once completed, you will get a confirmation banner at the top of the page. Now when you switch to the Dashboard page, you will see your card(s):
The card options allow you to view or remove the chart today (not as feature-rich as Log Insight yet):
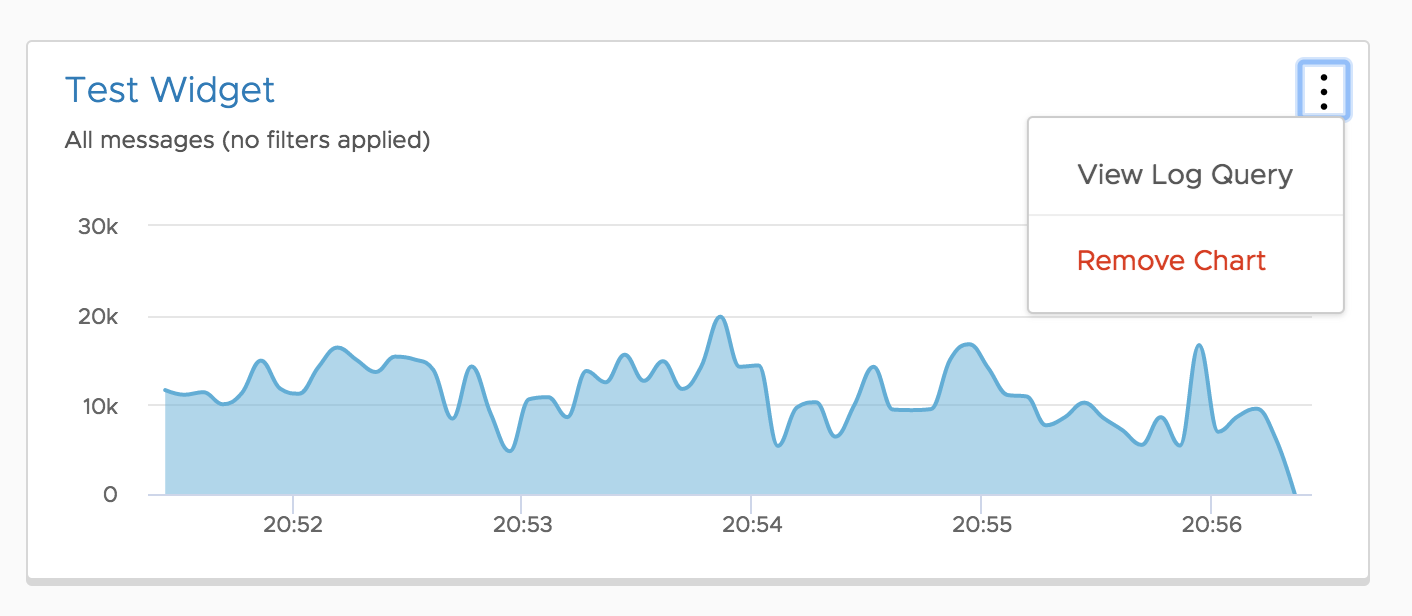
It should be noted the Dashboard page supports a maximum of six widgets today — expect this to change over time.
Summary
As you can see, the Dashboard page can be customized to your needs. What do you use dashboards for? What other features would you like to see?
© 2018 – 2021, Steve Flanders. All rights reserved.