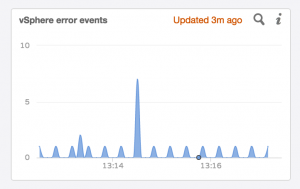
Several enhancements have been made to the UI in Log Insight 2.5. I would like to cover these enhancements starting with the change on the Dashboards page.
![]()
To date, the charts shown on the Dashboards page are loaded once when initially navigating to the Dashboard or when selecting the Update button next to the time range. Many people have requested the ability to automatically refresh the dashboards page. This can easily be achieved through a free client-side browser plugin like (quick Google search):
- Chrome: Auto Refresh, Refresh Monkey, Super Auto Refresh
- Firefox: ReloadEvery, Tab Auto Reload, Reload Plus
- Internet Explorer: AutoRefresher for IE
- Safari: Auto Refresh, Safari Tab Reloader
To remove the client-side dependency, optimize the use of the screen size, and make reload more efficient, Log Insight introduced a new feature known as real-time charts or presentation mode. This new feature is available on every dashboard and is a button to the right of the time range.
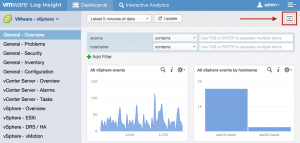
Upon selecting the button, the current dashboard goes into a full-screen, read-only mode.
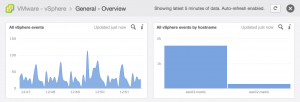
As you watch the screen you will see that the time range of the last refresh is updated on each dashboard widget.
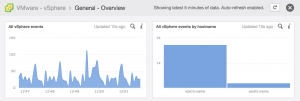
The time range specified for the dashboard when presentation mode is entered dictates the interval of the automatic refresh as follows:
- Latest 5 minutes – every 15 seconds
- Last hour – every 1 minute
- Last 24 hours – every 1 minute
- Custom – does not support presentation mode today
There are some important things to note about presentation mode:
- Presentation mode works for any dashboard (e.g. My Dashboards, Shared Dashboards or content packs).
- The automatic refresh interval is not editable today.
- The user session timeout does not apply to presentation mode.

- When in presentation mode, the view is read-only – you can view the information on each widget and you can run query list widgets (since they do not run automatically), but you cannot make any changes (e.g. dashboard filters). To make changes (e.g. dashboard filters), exit presentation mode, make and apply your changes and re-enter presentation mode.
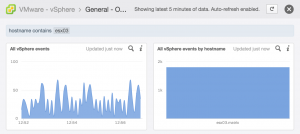
- Presentation mode applies to a single dashboard – if you desire multiple dashboards then you need to open them in separate tabs. To switch between the tabs you could use a free client-side browser plugin.
- The duration since the last automatic update may be displayed in red if the refresh is taking longer than expected. The two primary reasons why you might see this is:
- The auto-refresh only occurs if the browser window is in focus for performance reasons – if the window is out of focus and brought back into focus the charts will instantly update, but you may see a red warning of the last update duration.
- LI is under heavy query load and the presentation mode update queries are waiting in the pending queue – you can check the System Monitor > Active Queries tab to see if this is the case. Once the queue clears, the widgets will be updated.
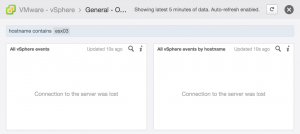
- If the client loses access to the server then the widgets will state that the connection to the server was lost.
- The refresh query happens at the widget level instead of the page level – this means that auto-refresh queries are much more efficient and less resource-intensive than using a client-side plugin.
As you can see, real-time charts are extremely powerful, especially for monitoring teams that display environmental information on large screen monitors.
UPDATE: Adjusted custom time range and performance improvements of this feature over client-side plugins.
© 2014 – 2021, Steve Flanders. All rights reserved.

