A feature that might be a little harder to locate, but one that provides powerful insight is the new log browsing and infinite scroll feature known in the UI as “View Event in Context”. I would like to dive into the feature to expose its value.

New Feature
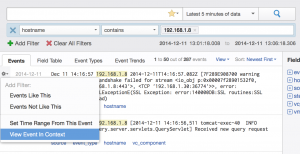
This new feature is available on the Interactive Analytics page. To access it, select the context menu (the gear icon to the left of any event) from any event (you need to hover over the event to see the context menu). From there you will see a new option called “View Event in Context”. Before I discuss this new option, I would like to highlight the option just above it so you can see the differences.

Set Time Range From This Event
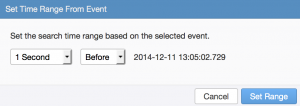
Just above “View Event in Context” in the context menu is a “Set Time Range From This Event” option. This option has always existed in Log Insight and I would encourage you to try it out if you have not noticed it before. It allows you to easily modify the time range for your current query. Upon selecting this option, you are presented with a dialog box with some inputs for time. You need to specify the time range you wish to search over and whether you care about events before, after, or around the event from which you selected this option.

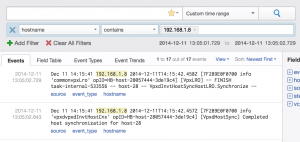
Upon filling out the options and selecting Set Range, the time range for your current query will automatically be set to a custom range based on the time on the event for which you selected the option.

As you can see, everything else remains the same. This is a powerful feature because it is common in troubleshooting scenarios that you find a relevant event, but you want to see events that happen around the same time in order to complete the picture and get to the root cause. Of course, you could manually enter the time range using the custom time range option from the search bar, but this context menu makes it much easier to get to the events you care about.
View Event in Context
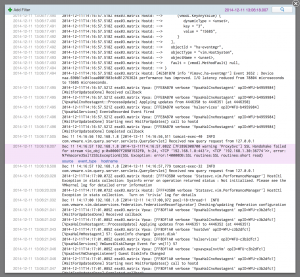
If you select the new “View Event in Context” option, you will get a whole different experience. With this option, a pop-up is displayed which shows you the event, from which you selected this option, highlighted and events that occurred before as well as after the event.

Once you get used to the new display you will probably notice that the query that was previously run is not preserved. The reason for this is because the purpose is to see the event from which the option was selected in the context of all other events. Depending on the query that you had constructed, “view event in context” may not make sense, to begin with. If it did make sense, then likely it was because it restricted the results to a subset of hosts or results from a single host. The good news is that it is very easy to add filters as desired in this context view. Assuming you want to restrict the query to the host that generated the event highlighted, you can select the hostname field and add it as a filter just like on the Interactive Analytics page. You also have the ability to leverage any of the fields in the highlighted event.
 You will notice that only the highlighted event contains fields, all the rest appear as log messages. The reason for this is because this view is meant to be similar to a live tail (e.g. tail -f) of your events. All other events do contain a context menu making it easy to control the events returned in this view.
 One reason why this view is so powerful is that it allows infinite scroll before and after the highlighted event. Simply scroll up or down as desired and Log Insight will fetch the appropriate results.
 Note, while in this view you have a true live tail experience and can scroll through even new events that have been ingested since this view was opened. After scrolling through events you may wish to get back to the highlighted event. To do this, click the time link in the upper right-hand corner of the pop-up window. You will also notice at the top that you can manually specify filters as desired just like on the Interactive Analytics page.
![]()
Differences
As you can see, the “Set Time Range For This Event” and “View Event in Context” options provide powerful features in different ways:
- Set Time Range For This Event
- Keeps all existing filters
- Keeps current view of events (e.g. timestamp and fields)
- Remains on Interactive Analytics page
- Only changes the time range based on the selected event
- Limited to 50 results per page
- Does not provide a live tail – page can be refreshed to get new results
- Difficult to get back to the original message
- Possible to leverage event trends and event types views
- View Event in Context
- Removes all filters
- Changes view to exclude fields from all events except selected event
- Switches to a pop-up window view
- Shows events before and after the selected event
- Provides unlimited results in any direction
- Provides a live tail
- Easy to get back to the original message
- Must close pop-up to leverage event trends and event types views
Summary
The “Set Time Range For This Event” option makes it possible to see events based on your current query within a fixed time range for easy troubleshooting and root cause analysis. In addition, machine learning functions (e.g. event types and event trends) can be used with this option to assist in log analysis. This option is helpful when it is possible to pinpoint problems and isolate time ranges for events that have already occurred.
The “View Event in Context” option makes it possible to see events throughout an environment or isolated to a subset of the environment over a more dynamic time range. This option provides log tailing functionality that will be familiar for many system administrators and software developers easing troubleshooting and root cause analysis. When attempting to analyze logs over a large and/or real-time subset of events this option provides the most insight.
© 2014 – 2021, Steve Flanders. All rights reserved.
