
In my last post, I explained why you might see a gap in data on Log Insight charts. In this post, I would like to discuss a gap in data and the time range specified for a query.
Example
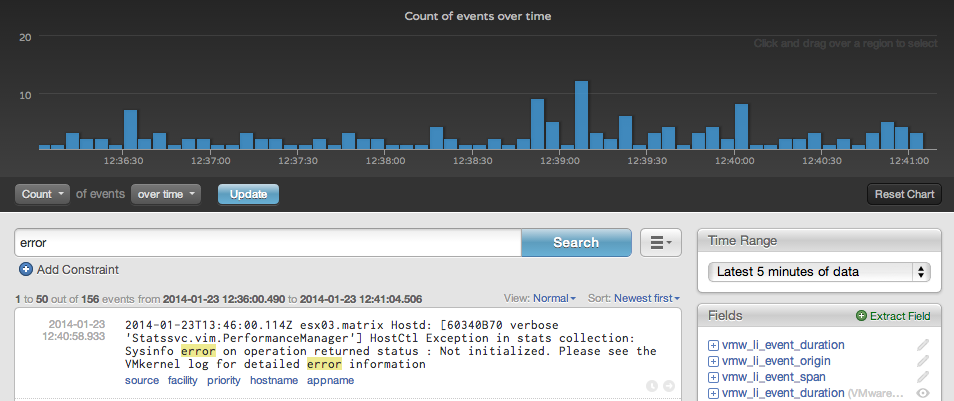
A follow-up question I get to the question, “Why do I see a gap in data on Log Insight charts?” is, “Why do I see results for a query outside of the time range I specified?” An example of this scenario would be something like the following:
In the above example, a query has been constructed with a time range specified of the latest 5 minutes of data. From the chart, you can see that the results are from about three hours ago (look at the x-axis of the aggregation chart).
Why are results shown outside of the time range specified?
No results are shown outside of the time range specified. Wait, what? That’s right, read the time range carefully, latest 5 minutes OF DATA. The time range is not the literal latest 5 minutes, but the latest 5 minutes OF DATA. In the above example, no events have been received by Log Insight in about three hours. Five minutes before the last event was received, which was over three hours ago, results exist for the keyword error and thus why results are shown.
How about another example?
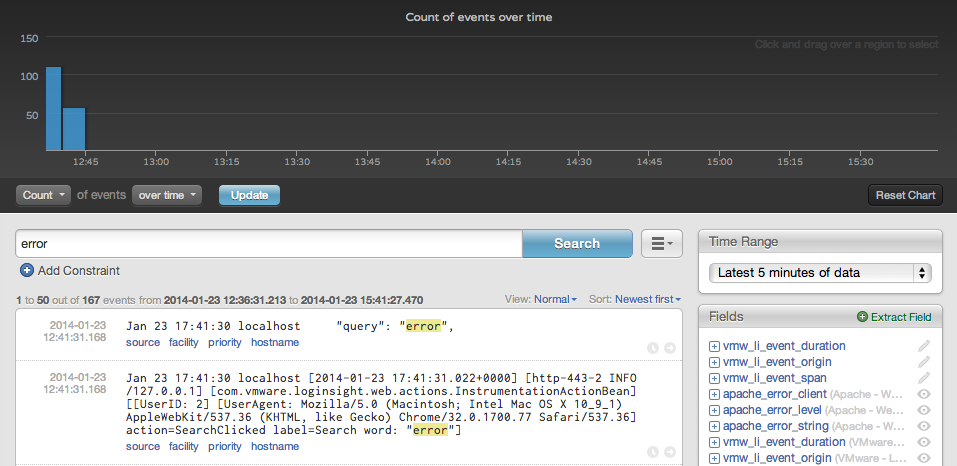
OK, let’s query for the keyword error:
The results show that the keyword error appears multiple times and is present within the literal last five minutes (compare the x-axis of the aggregation chart to the time range specified in the query). No gaps are seen in the aggregation chart, but gaps could be seen even if the scale of the chart is the same as the time range specified in the query (this would just mean that only a few events were seen for the query in the given time range). Now, let’s query for the keyword low:
The results show that the keyword low does not appear within the literal last five minutes of data (compare the x-axis of the aggregation chart to the time range specified in the query). We know from running the query with the keyword error that events do exist within the literal last five minutes. This means that the keyword low has not appeared within the literal last five minutes. However, this does not mean that the keyword low has does not exist in the system. Increasing the time range for the query will return results if results exist for the new time range specified.
In this second example, we have confirmed Log Insight has received events within the literal last five minutes. We have also confirmed that Log Insight will display any results returned by the query or will display no results.
Why would the time range of the chart not match the query?
If the time range for a query in the aggregation chart does not match the time range specified in the query then this means Log Insight has not received any events within the literal time range specified in the query. Two primary reasons can explain how this scenario would occur:
- If this scenario is noticed on a Log Insight instance that should be receiving syslog events then this means Log Insight is not receiving events and the configuration should be investigated to determine why. This likely points to an issue within the environment.
- If a dedicated Log Insight instance has been configured to ingest one or more archive files (best practice is to dedicate a Log Insight instance for archives) then no events may exist in the system for the literal time range specified in the query given the timestamps of the events in the archive files. This is expected behavior.
© 2014 – 2021, Steve Flanders. All rights reserved.