
Log Insight provides multiple different ways to save queries (e.g. extracted fields, favorites, alerts, and dashboard widgets). To date, only extracted fields could be edited after they were saved. In Log Insight 2.5, the ability to edit all types of saved queries has been introduced. I would like to walk through how queries can be edited and what this new feature means to Log Insight users.

Previously
Prior to Log Insight 2.5, if you saved any query except for an extracted field you were very limited on what you could edit. While the title and notes could be changed after the fact, the query and visual representation were read-only. If you needed to edit a saved query of any type then you needed to:
- Run the saved query on Interactive Analytics
- Modify the query as desired
- Run the new query
- Save the new query
- Copy the title from the old query
- Copy the notes from the old query
- Go to where the old query is
- Delete the old query
While this was doable, copying the title and notes was cumbersome and time consuming. If you were only editing a single saved query this may not be a big deal, but especially for content pack authors this editing process was less than ideal.
New
Now, every saved query can be edited in place and navigating back to the query after editing is easy. Let me walk through how this process works with a dashboard chart widget. Before I start, it is important to note that dashboard widgets can only be edited by users with the appropriate permissions. The following rules apply:
- Content packs are read-only
- You can clone a content pack widget to your user space if desired for editing
- Shared Dashboards can only be edited by users with permission to modify shared content
- There is a shared content permission in LI 2.5 (more on this in a future post)
- For previous versions of LI only admin users have permissions to Shared Dashboards
- My Dashboards can be viewed and edited only by the currently signed in user
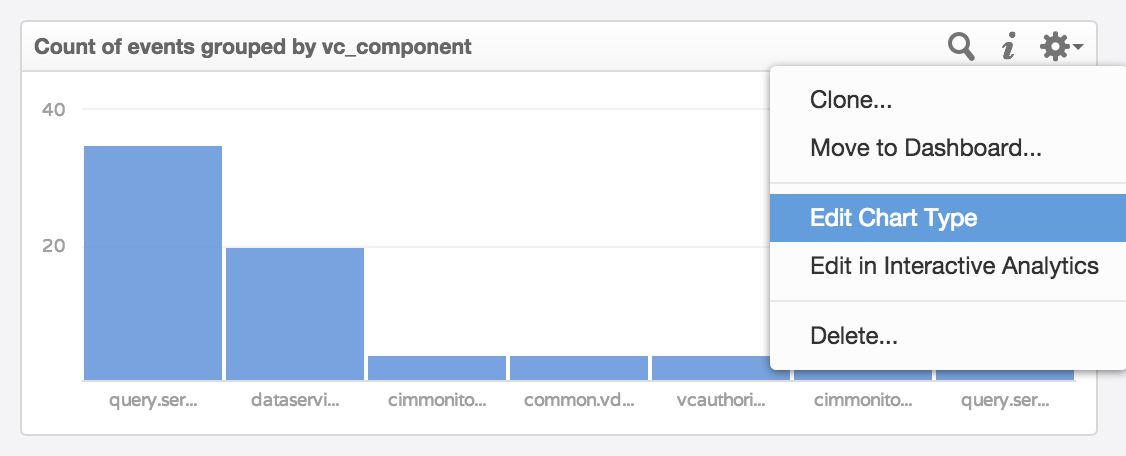
Let’s assume I have a chart widget under My Dashboards that I wish to edit. I can select the gear icon within the widget and I am presented with some new options from previous versions of LI, namely:
- Edit Chart Type
- Edit in Interactive Analytics
I will start with the Edit Chart Type option, which is a special edit query option available only to dashboard chart widgets. This option allows you to modify the visualization of the dashboard chart widget without leaving the Dashboards page.
 Upon selecting the option, an overlay appears, similar to what you would see on the Interactive Analytics page, allowing you to switch to different supported chart types based on the current query for the dashboard chart widget.
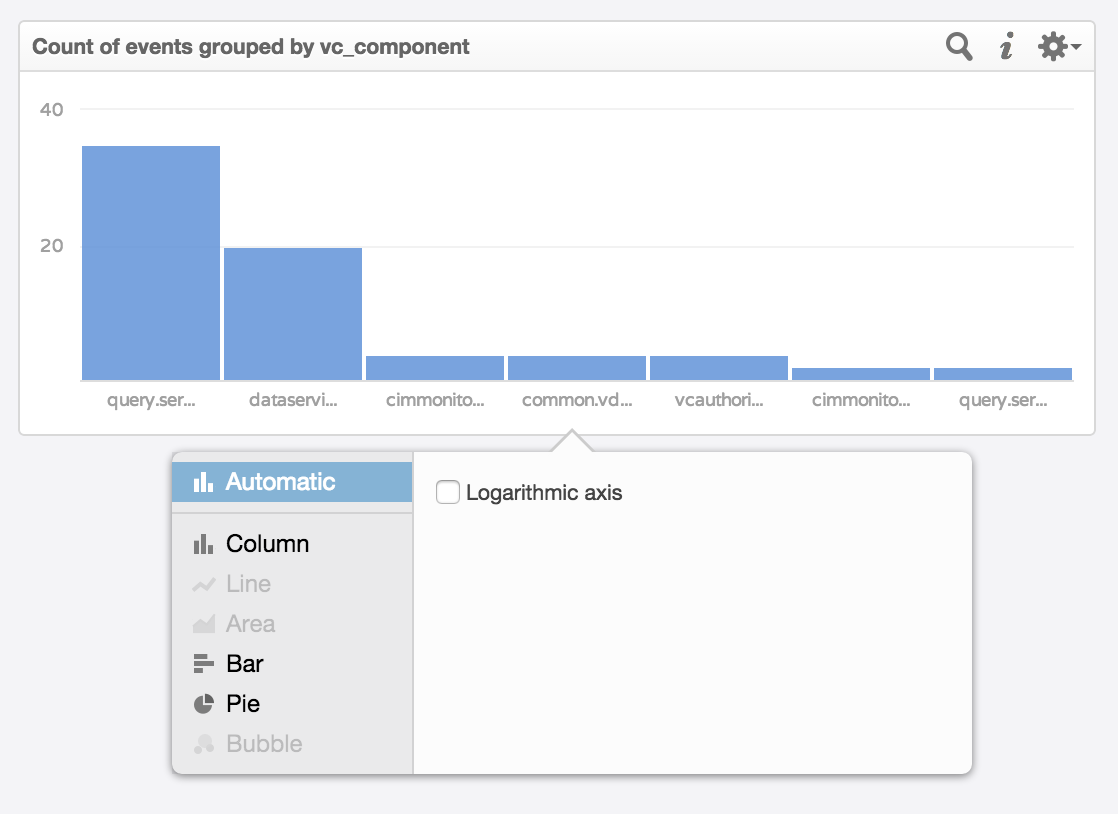
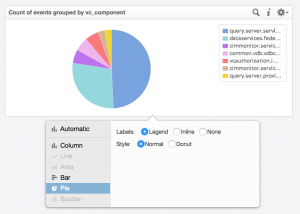
When a new chart type is selected, the visualization is instantly updated. To permanently save the new chart type, click anywhere outside of the dashboard chart widget and chart type overlay.
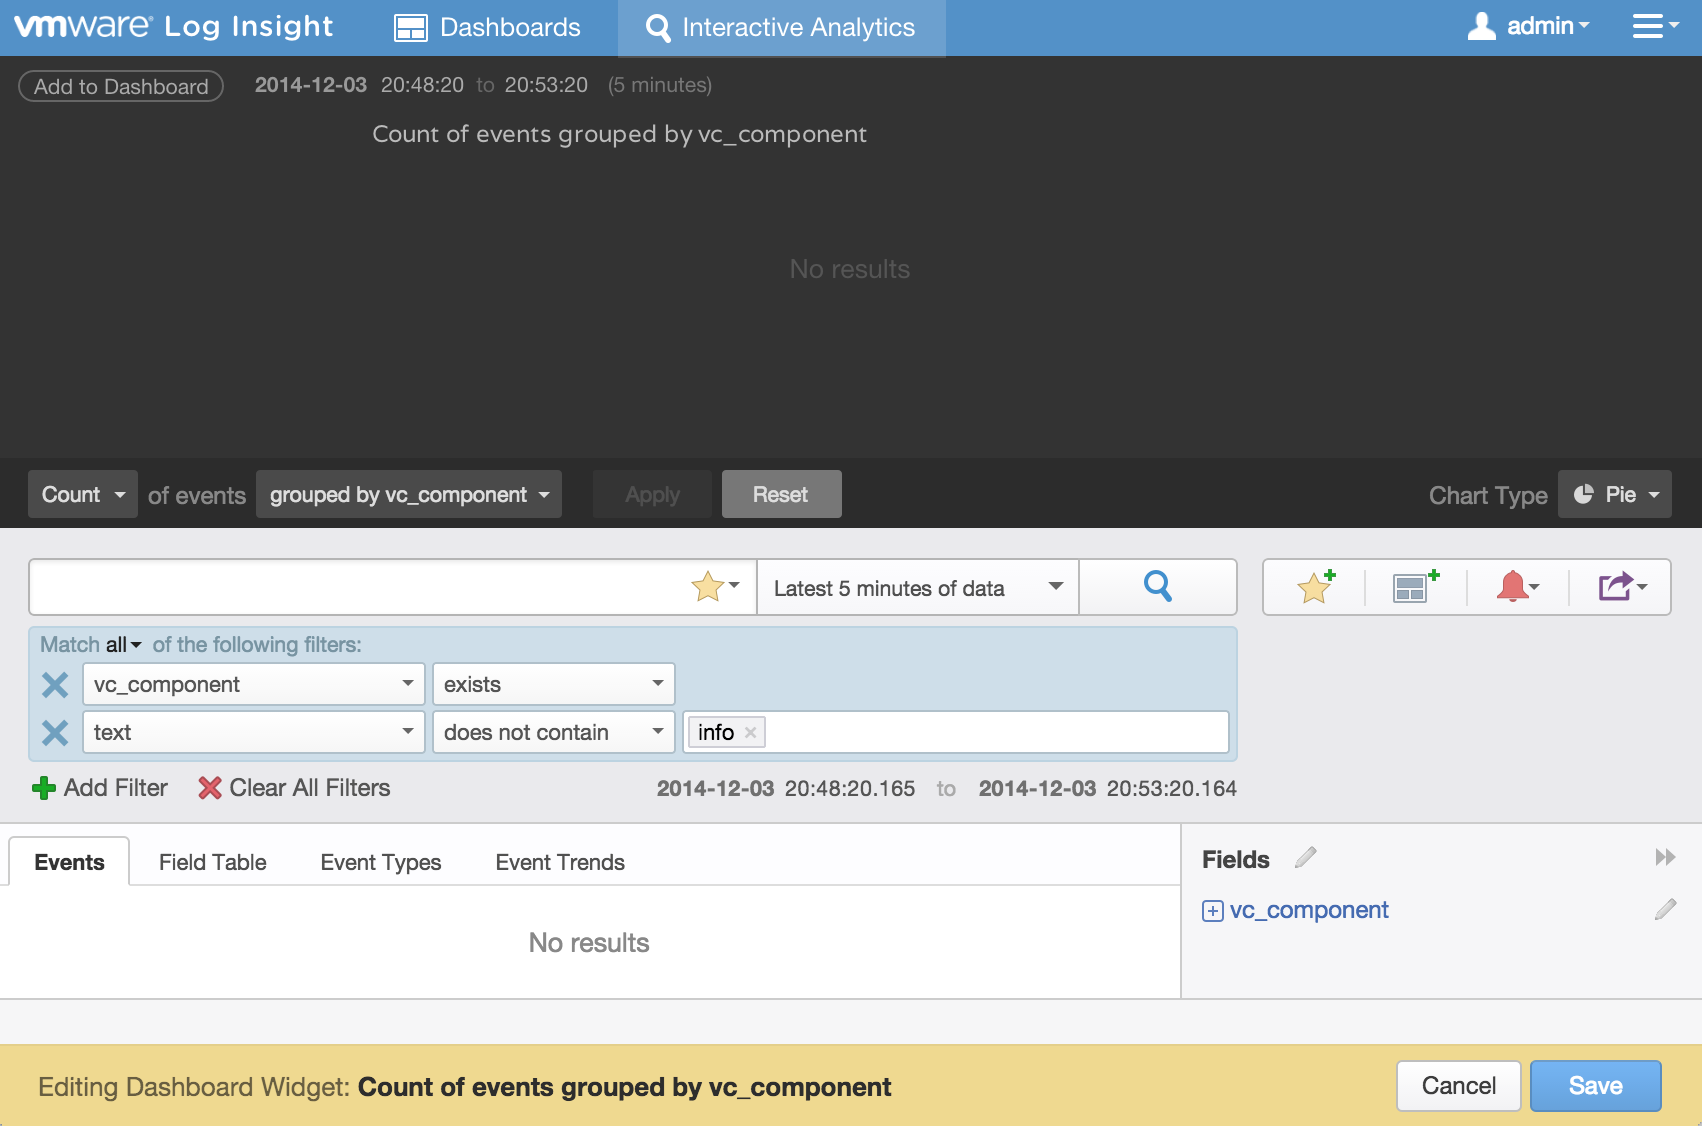
The other option available for dashboard widgets is Edit on Interactive Analytics. Upon selecting this option you are navigated to the Interactive Analytics page with the current query for the widget displayed and run. In addition, you will notice a banner at the bottom notifying you that you are in edit mode.
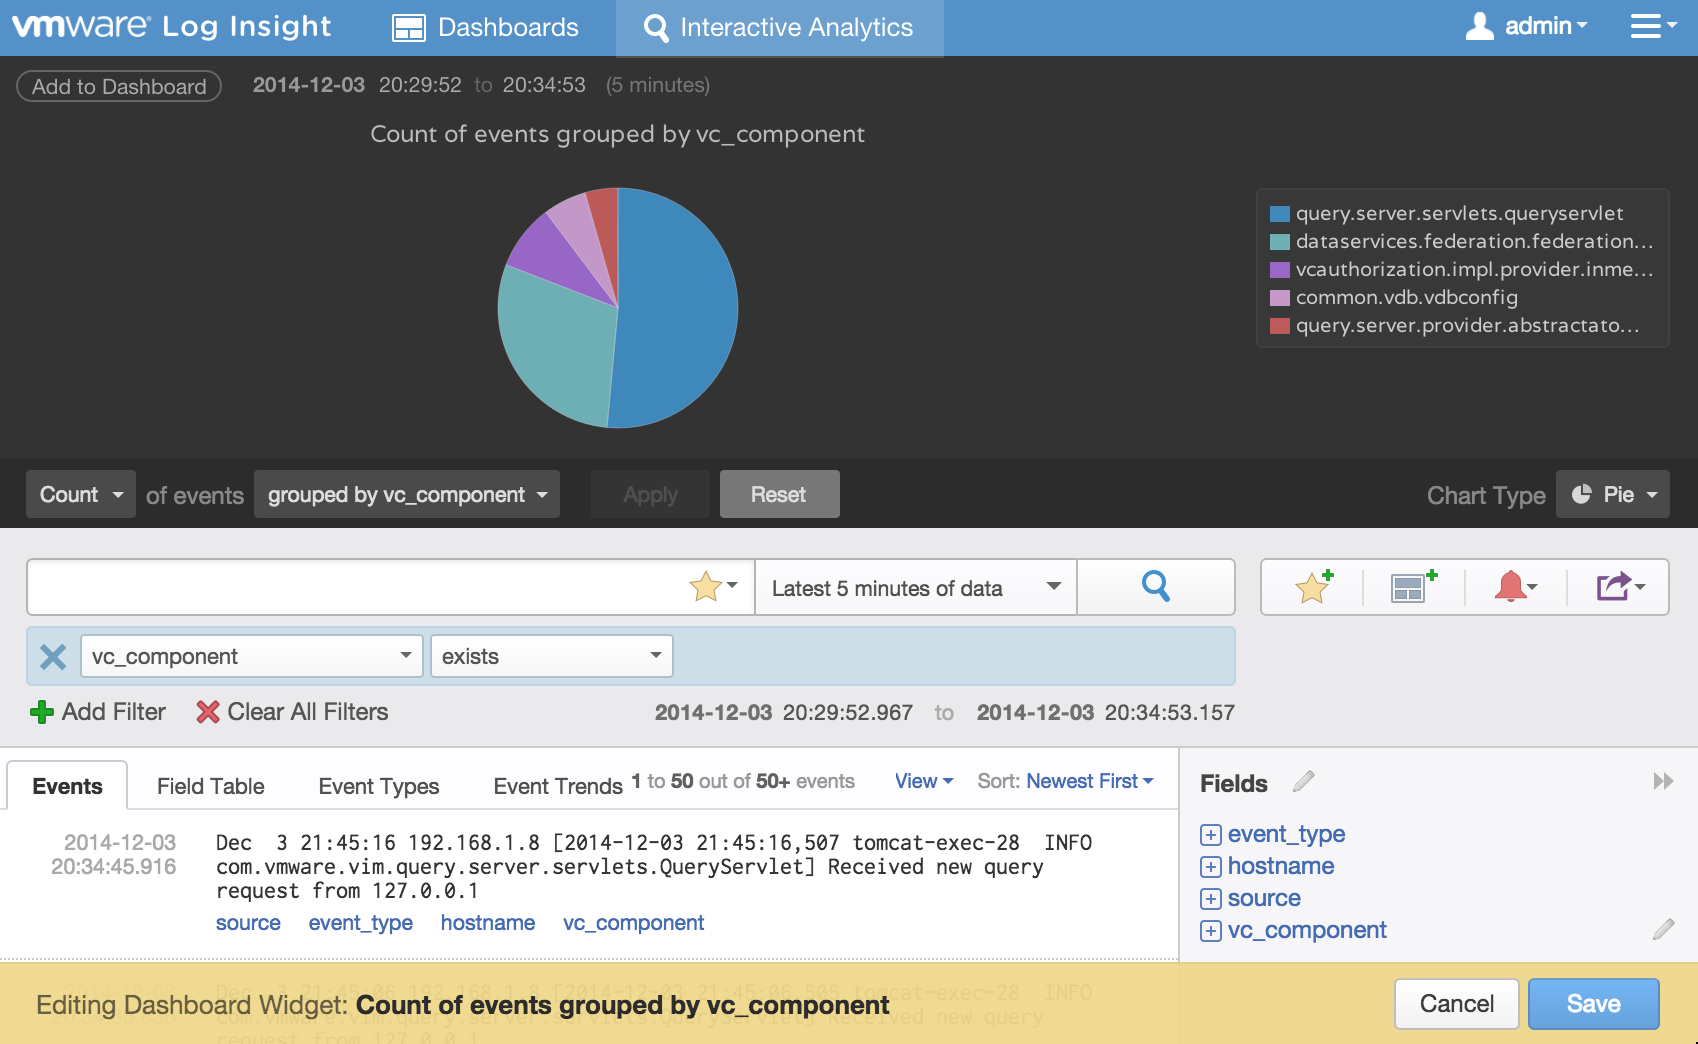
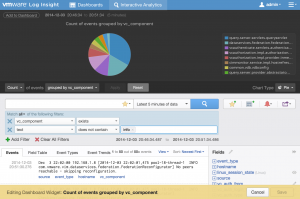
You can now modify your query as desired. As an example, let me select the “Add Filter” button and add a filter for text that does not contain info, but I will not hit enter to actually run the query.
You will notice a couple of things:
- The search button to the right of the search bar has changed from a blue magnifying glass with a gray background to a white magnifying glass with a blue background. This indicates that the current query has not been run yet.
- The Save button for the edit query banner has been grayed out. This indicates that the current query has been edited, but has not been run yet so it cannot be saved.
In order to save the changes, the modified query needs to be run. Upon selecting the search button, the Save button becomes available.
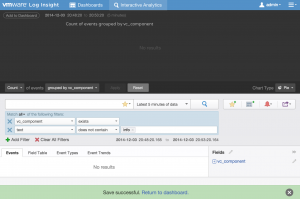
Upon selecting the Save button, the edit query banner switches to green and provides a link back to the dashboard widget.
Note: For dashboard widgets, it is not possible to switch between different types of dashboard widget types. For example, during the edit process you cannot switch from a chart widget to a query list widget or field table. If you need to perform such a change, you will need to revert to the previous way of editing queries defined above.
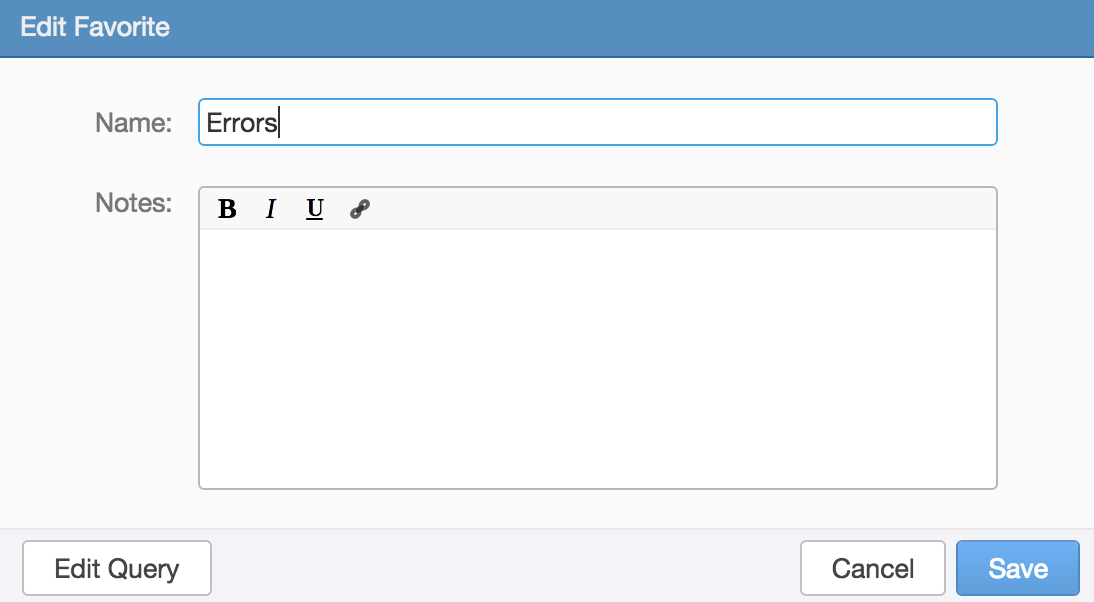
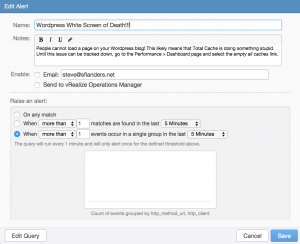
As mentioned at the beginning of this post, all saved queries now support editing. For example, you can select the pencil edit icon for one of your favorite queries (remember not content pack queries) and you will notice an Edit Query button in the bottom left-hand corner.
The same applies from the Manage Alerts section (again not content pack alerts).
As you can see, editing queries is now simple and easy!
© 2014 – 2021, Steve Flanders. All rights reserved.