
Now that you have deployed, configured, and are sending syslog traffic to Log Insight you can start using the product! Next, I would like to cover what you see when you initially log into the Log Insight web UI, the Dashboards page.
Navigation Bar
First, whether you are sending syslog traffic to Log Insight or not, once the appliance has been deployed and configured you will notice the default navigation bar on the top of each web UI page:
![]()
This bar is broken up into the following links (from left to right in regards to the highlighted boxes above):
- Dashboards – The default page. You can think of the dashboards page as an overview section. It contains mostly chart widgets and allows you to quickly digest log data and determine potential issues in your environment.
- Interactive Analytics – Where administrators and engineers can drill down into log messages to determine problem areas and perform root cause analysis.
- User Options – Allows the currently signed in user to modify their profile or logout.
- Other Options – Contains other information and settings including Administration, Content Pack, About, and Help links
It is also worth mentioning that the vCenter Log Insight logo is a link to the default page (i.e. Dashboards).
Dashboard Pages
Since this post assumes you are sending syslog traffic to Log Insight, let’s start with what Log Insight presents to you when you log into the web UI:
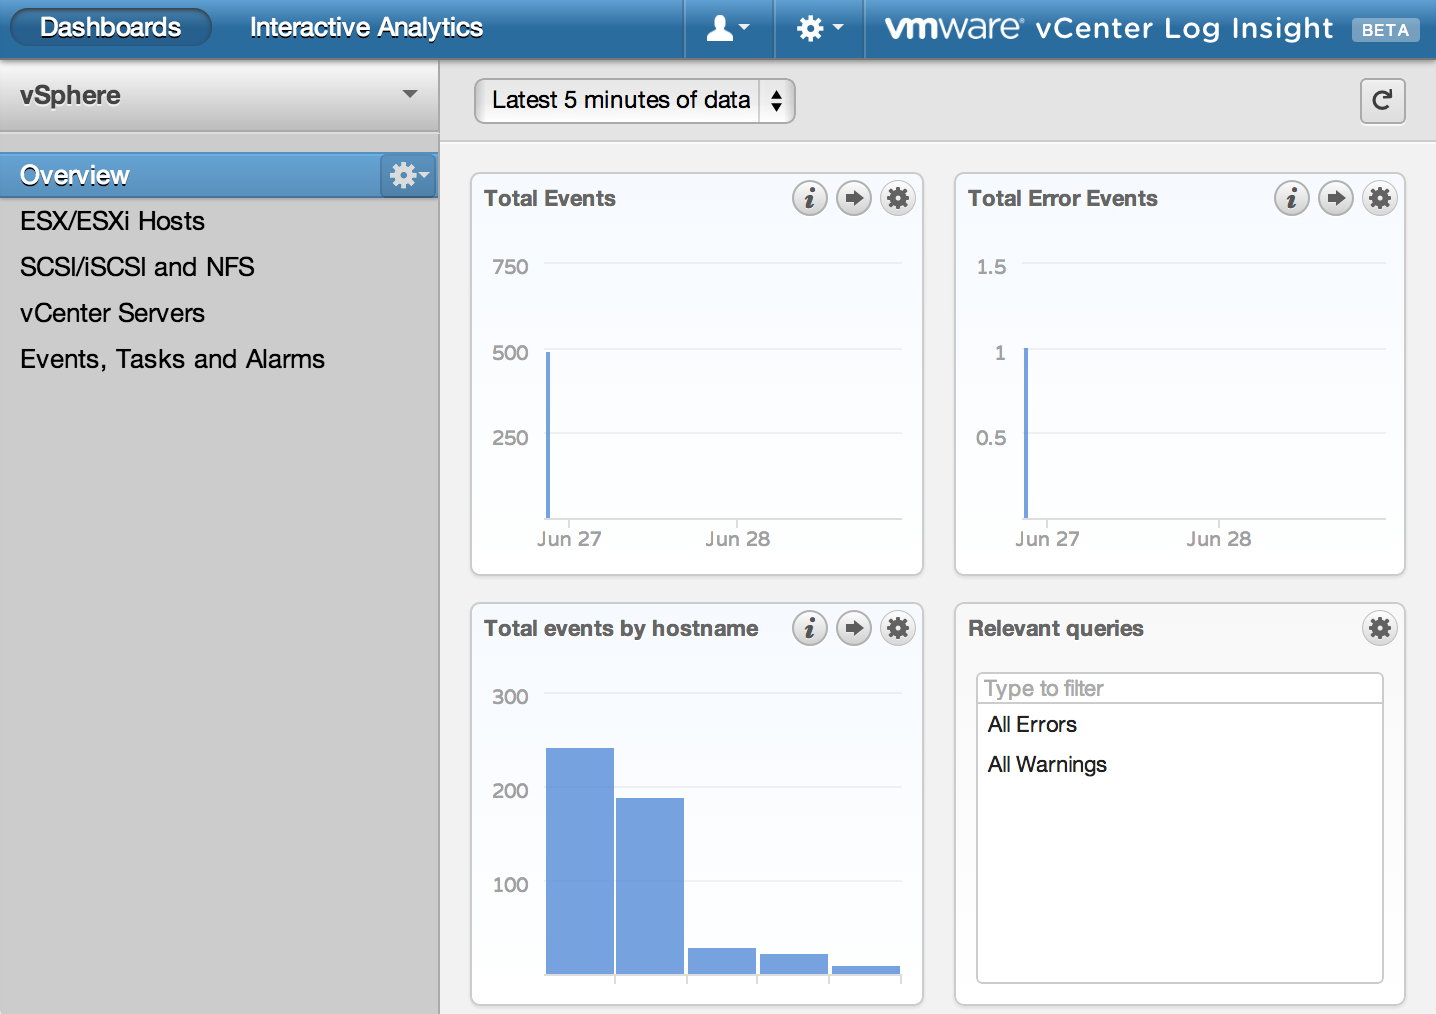
Log Insight is specifically tailored for VMware environments and as such drops you initially into the overview dashboard page of the vSphere content pack (more on content packs below). This dashboard page provides you with widgets, most of which give you a visual representation of your data.
So how is a dashboard page broken up?
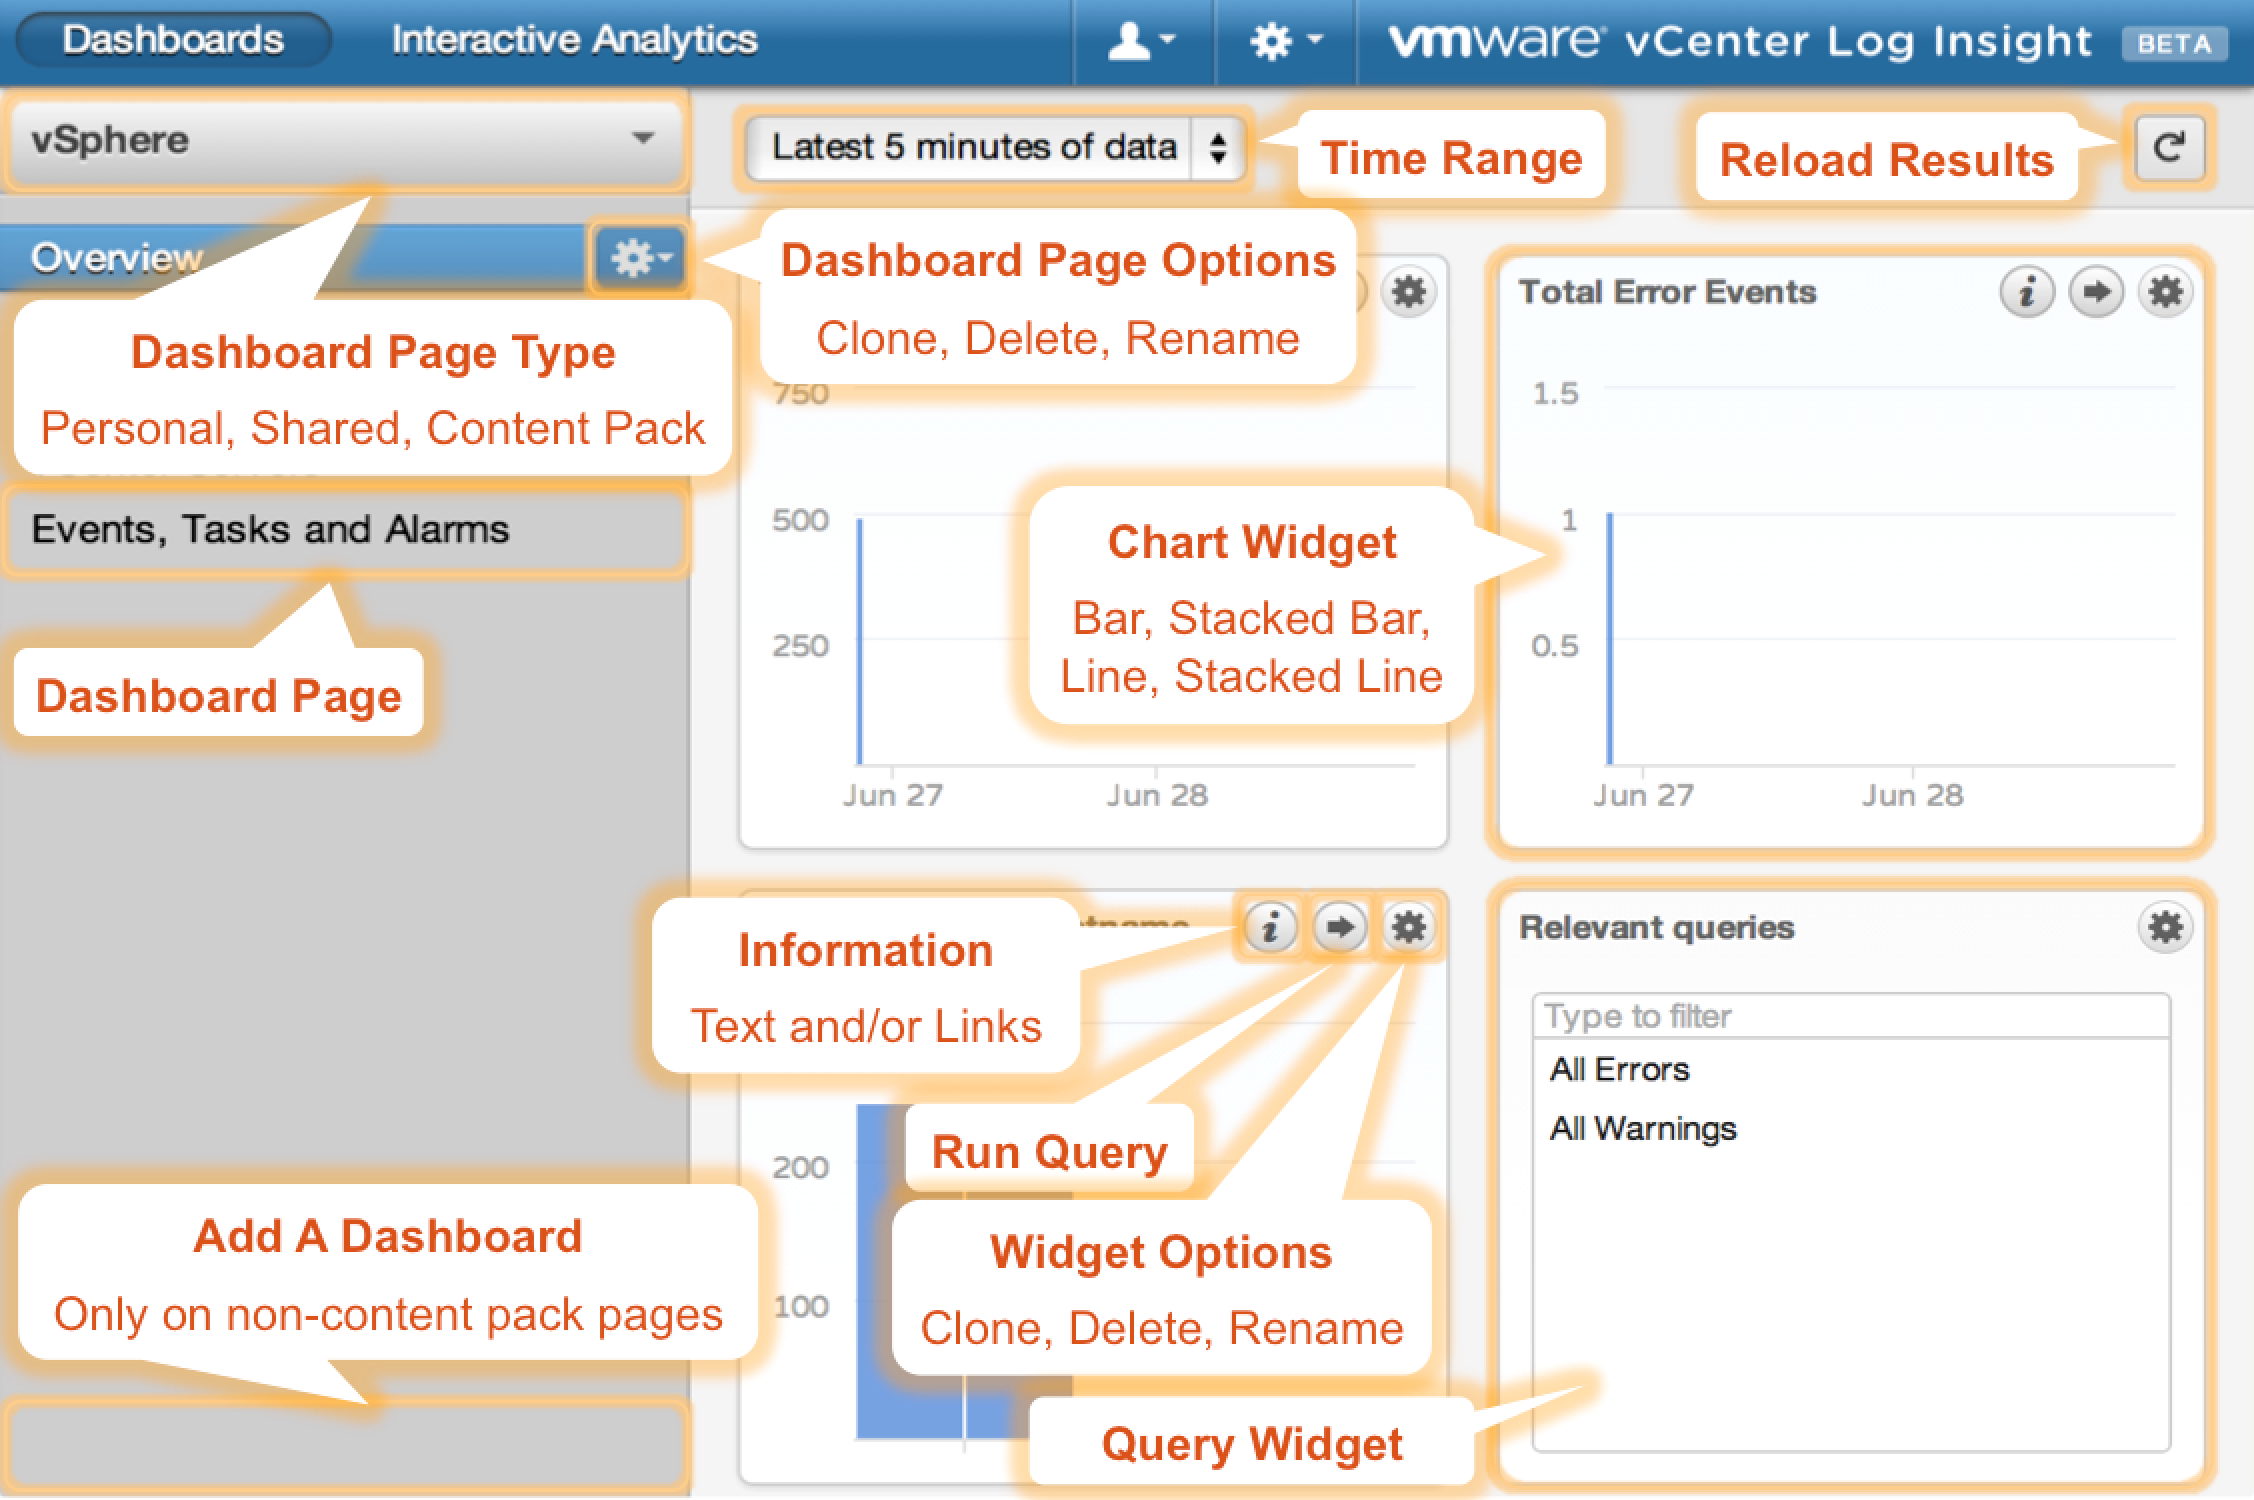
As you can see, a dashboard page presents you with a lot of information and options. Some important information to keep in mind about dashboard pages:
- The time range is applicable to when Log Insight received log data – meaning unless no results are returned or a custom time range is defined, the chart widget will always be populated. This distinction is important because you may be wondering why you are seeing a gap in data in the chart widget (see Total Error Events chart above for an example).
- The time range and as such the chart widget are applicable to when the page was loaded (i.e. chart widgets are not dynamically updated.) If you wish to see updated data in chart widgets you need to select the reload button.
- If you see a chart widget that states ‘no results’ then that means that the query behind the chart widget returned no results. You should not have empty chart widgets on the overview dashboard page of the vSphere content pack, but you may for the other dashboard pages (more on this below).
Widgets
In terms of widgets, Log Insight provides two different types today: charts and queries. Charts are a visual representation of data and the most commonly used widget. Queries are saved pieces of information that provide both a visual and textual representation of data on the Interactive Analytics page (I will be covering the Interactive Analytics page in my next post), but are listed only by a defined name on the dashboards page. Query widgets are typically used when a chart widget does not necessarily provide useful information.
NOTE: Query widgets cannot be created from the web UI today. As such, you will typically only see them in the vSphere content pack.
For every widget you will notice one or more buttons in the top left corner. These buttons perform different actions as outlined in the image above. Let’s go over them:
- The ‘i’ stands for Information and provides some additional context about a widget. This context could be text and/or links. While the information field of charts is not required, you will notice that the vSphere content pack provides information for each of its widgets.
- The ‘->’ is a run query button. Every chart widget is generated by an underlining query. What is missing from a chart widget is the textual representation of data, something that is often necessary for troubleshooting and root cause analysis. Selecting this option will launch you into the Interactive Analytics page and run the query used to generate the chart.
- The gear button is for other options and more specifically cloning, deleting. and renaming widgets.
Left Sidebar
Looking on the left side of a dashboard page you will see the following things:
- Dashboard group – By default this is the vSphere content pack, but you can change it.
- One or more dashboard pages – While a dashboard group does not require a dashboard page, the group is pointless without one. You will notice that when a dashboard page is selected, it has a gear button, which allows for modification of the page similar to widgets.
- The ability to add a new dashboard page – This depends on which dashboard group is selected and the role of the current user (for content packs this option is not available, but I have highlighted where it would be in the image above.)
Dashboard Group
As the name implies, a dashboard group allows for the grouping of one or more dashboard pages. Log Insight allows for two different types of dashboard groups today:

- Custom Dashboards – Dashboards that are specific to a particular Log Insight instance.
- My Dashboards – Private dashboard group for the current signed in user. R/W for currently signed in user, no permissions to anyone else.
- Shared Dashboards – Public dashboard group to this instance of Log Insight. R/W for admin users, R/O for everyone else.
- Content Pack Dashboards – Dashboards that can be shared between Log Insight instances. R/O for everyone, but admin users can remove.
Content Packs
Content Pack is a word I have used multiple times now so let me actually define what it is and why it is important. A content pack is a special type of dashboard group in that it is the only dashboard group that is R/O to everyone. It is also special in that it can be imported into any instance of Log Insight (i.e. it is a plugin or module and allows for information to be shared between different Log Insight instances.) As mentioned previously, by default Log Insight ships with the vSphere content pack. This content pack consists of five different dashboard pages today:
- Overview – Contains widgets with information about all data in your Log Insight instance.
NOTE: Though this is the vSphere Overview dashboard page, please note the widgets are applicable to all log messages in the Log Insight instance and not just vSphere log messages.
- ESX/ESXi hosts – Contains widgets specific to log messages generated by ESX/ESXi hosts.
NOTE: If you are not sending ESX/ESXi hosts log traffic to Log Insight then these widgets will not produce any results. Remember, Log Insight can configure ESXi hosts to send syslog traffic to Log Insight via the configure-esxi script. ESX hosts must be configured by other means to send syslog traffic to Log Insight.
- SCSI/NFS – Same as ESX/ESXi hosts.
- vCenter Server – Contains widgets specific to log messages generated by vCenter Server instances.
NOTE: Log Insight does not configure vCenter Server instances to send log traffic to Log Insight. You must configure this through other means. vCenter Server integration does not configure vCenter Server instances to send log traffic to Log Insight. vCenter Server integration only applies to events, tasks, and alarms.
- Events, Tasks, and Alarms – Contains widgets specific to messages extracted from the vCenter Server database.
NOTE: vCenter Server integration must be configured on Log Insight for these widgets to generate results.
© 2013, Steve Flanders. All rights reserved.