
Next, I would like to give an overview of the Interactive Analytics page. This view allows administrators and engineers to drill down into log messages, to determine problem areas, and to perform root cause analysis.
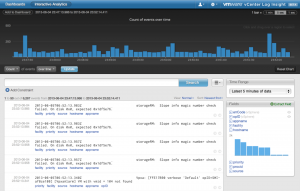
Let’s start with what the Interactive Analytics page looks like:
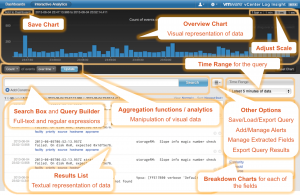
Now, let’s break down most of the sections and options on this page.
Visual Representation
At the top of the page, just below the navigation bar, you will notice a section with a black background. This section gives you a visual representation of your log data.
The chart in this section should look similar to the chart widgets that you saw on the Dashboards page. By default, the overview chart is a bar chart that displays the count of all events over time for the log messages seen over the last five minutes. Log Insight refers to ingested data as events. The events visually represented on the overview chart can be manipulated in a variety of ways, but most commonly are changed through the use of functions and groupings.
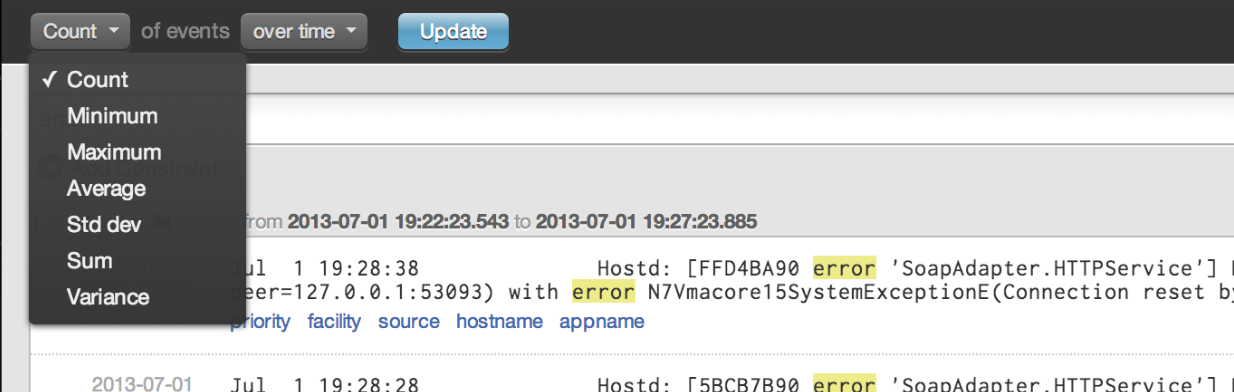
Count is an example of a function and if you select the Count drop-down menu you will see a list of all available functions:
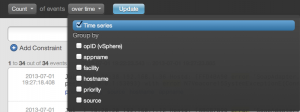
Groupings allow for events to be visually represented in one or more logical manners. By default, Log Insight groups events over time, but this can be changed as needed.
Textual Representation
In the bottom, left side of the Interactive Analytics page you will see a textual representation of your log data. Each row represents an event that Log Insight has ingested.
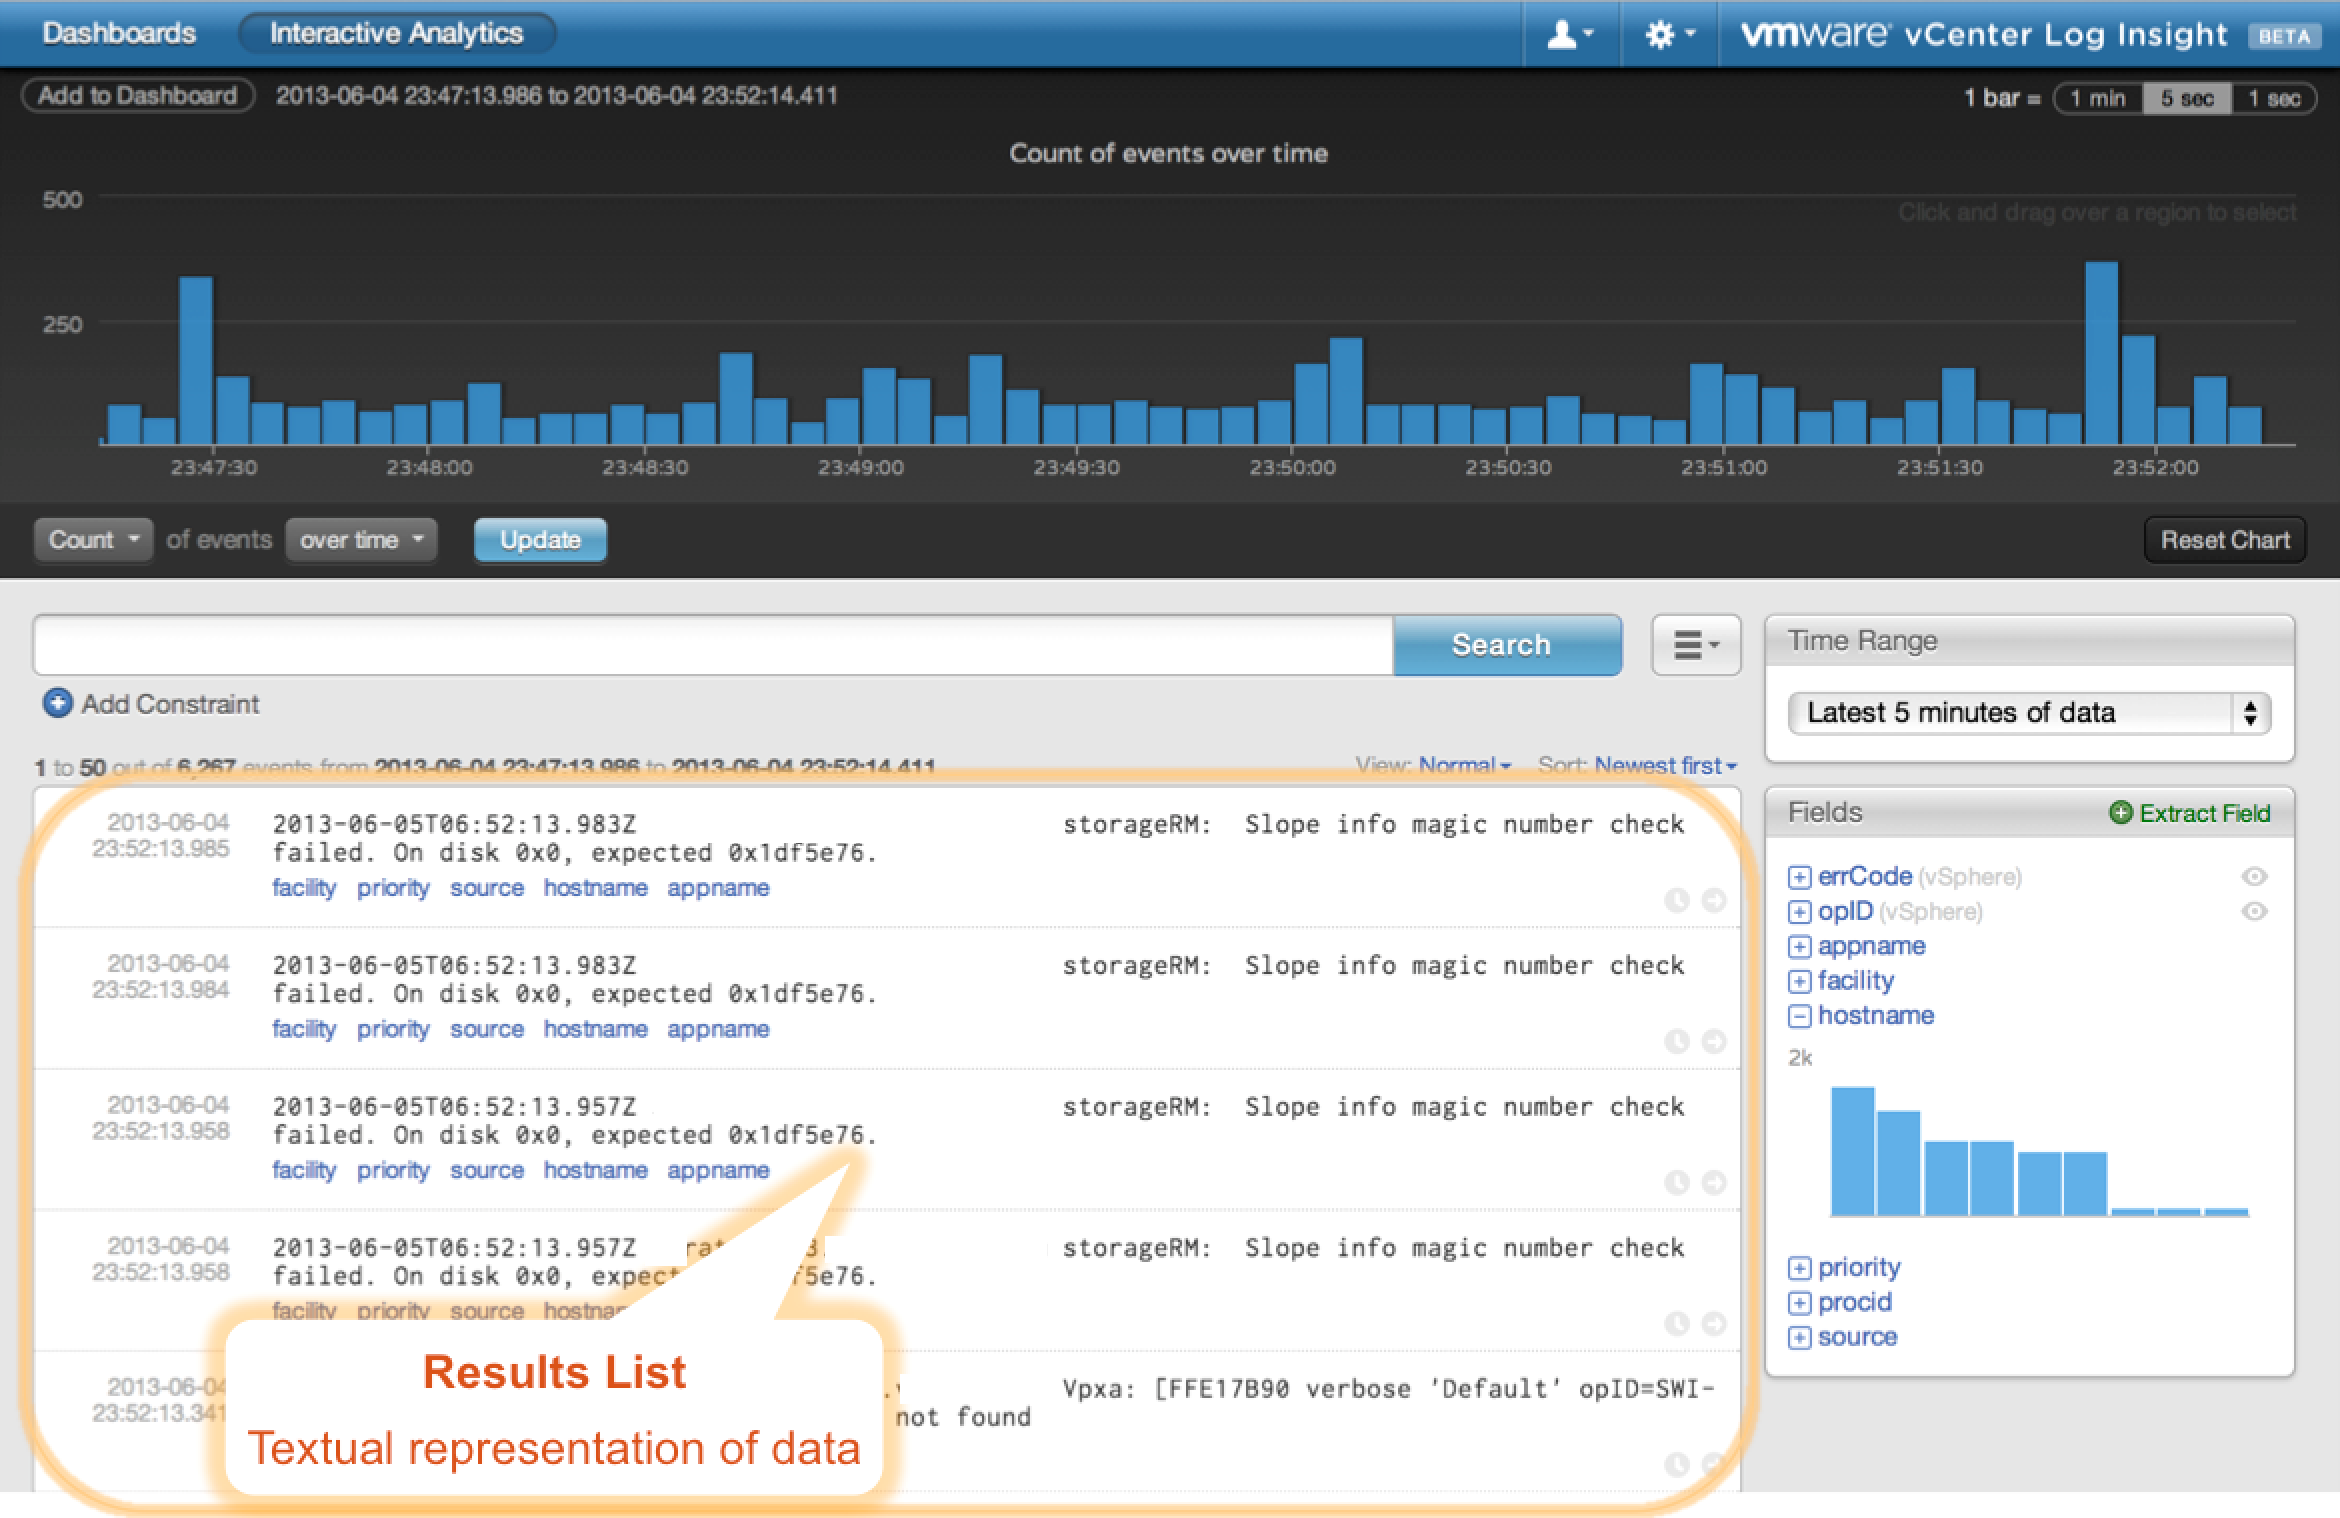
Let’s take a look at what a row typically looks like:
![]()
You will notice that each event has one or more timestamps. Each event is guaranteed to have a timestamp in gray to the left of the actual event. This timestamp represents the time on the Log Insight virtual appliance when the event was ingested.
NOTE: The timestamp in gray may have a small discrepancy from the timestamp in the event. This discrepancy should always be ahead of the timestamp in the event. If the discrepancy is large or behind the timestamp in the event then this points to a time synchronization problem in the environment.
Other timestamps may be shown in the event message itself. Per the syslog RFC, a syslog message should contain the timestamp of when the log message was generated.
In addition to the timestamp and actual event, below the event you will typically see one or more fields represented as blue keyword links. Fields are a way to add structure to events. Log Insight creates some static fields during ingestion through the use of parsers. The best example of this would be statically defined RFC syslog fields including facility, priority, source, hostname, and appname. Since, by definition, RFC compliant syslog messages contain these fields, Log Insight extracts them if they are found in an event. In addition to static fields, Log Insight allows for custom defined fields to be created.
Fields
Fields are custom defined pattern matches in a particular event. Fields that match for events found on the current page of results are displayed in the Fields section of the Interactive Analytics page:

Custom fields can be created by selecting any part of an event and then selecting the Extract Field button that appears to the right of found fields in an event row or by selecting the Extract Field button in the Fields section of the Interactive Analytics page.
Query Building
Between the visual and textual representation of your log data you will notice a search box:
Log Insight allows for full-text, or what I like to refer to as natural language, searching. Simply enter the keywords you are looking for and Log Insight will do the rest. In short, Log Insight does not require you to learn a proprietary query language.
In addition to the search box, you will notice an option to add constraints. A constraint is a way of further refining a query. Constraints allow for the use of regular expressions and also for querying through the use of fields.
Time Range
Just like in the Dashboards page, the Interactive Analytics page has a time range, which is used when running a query:
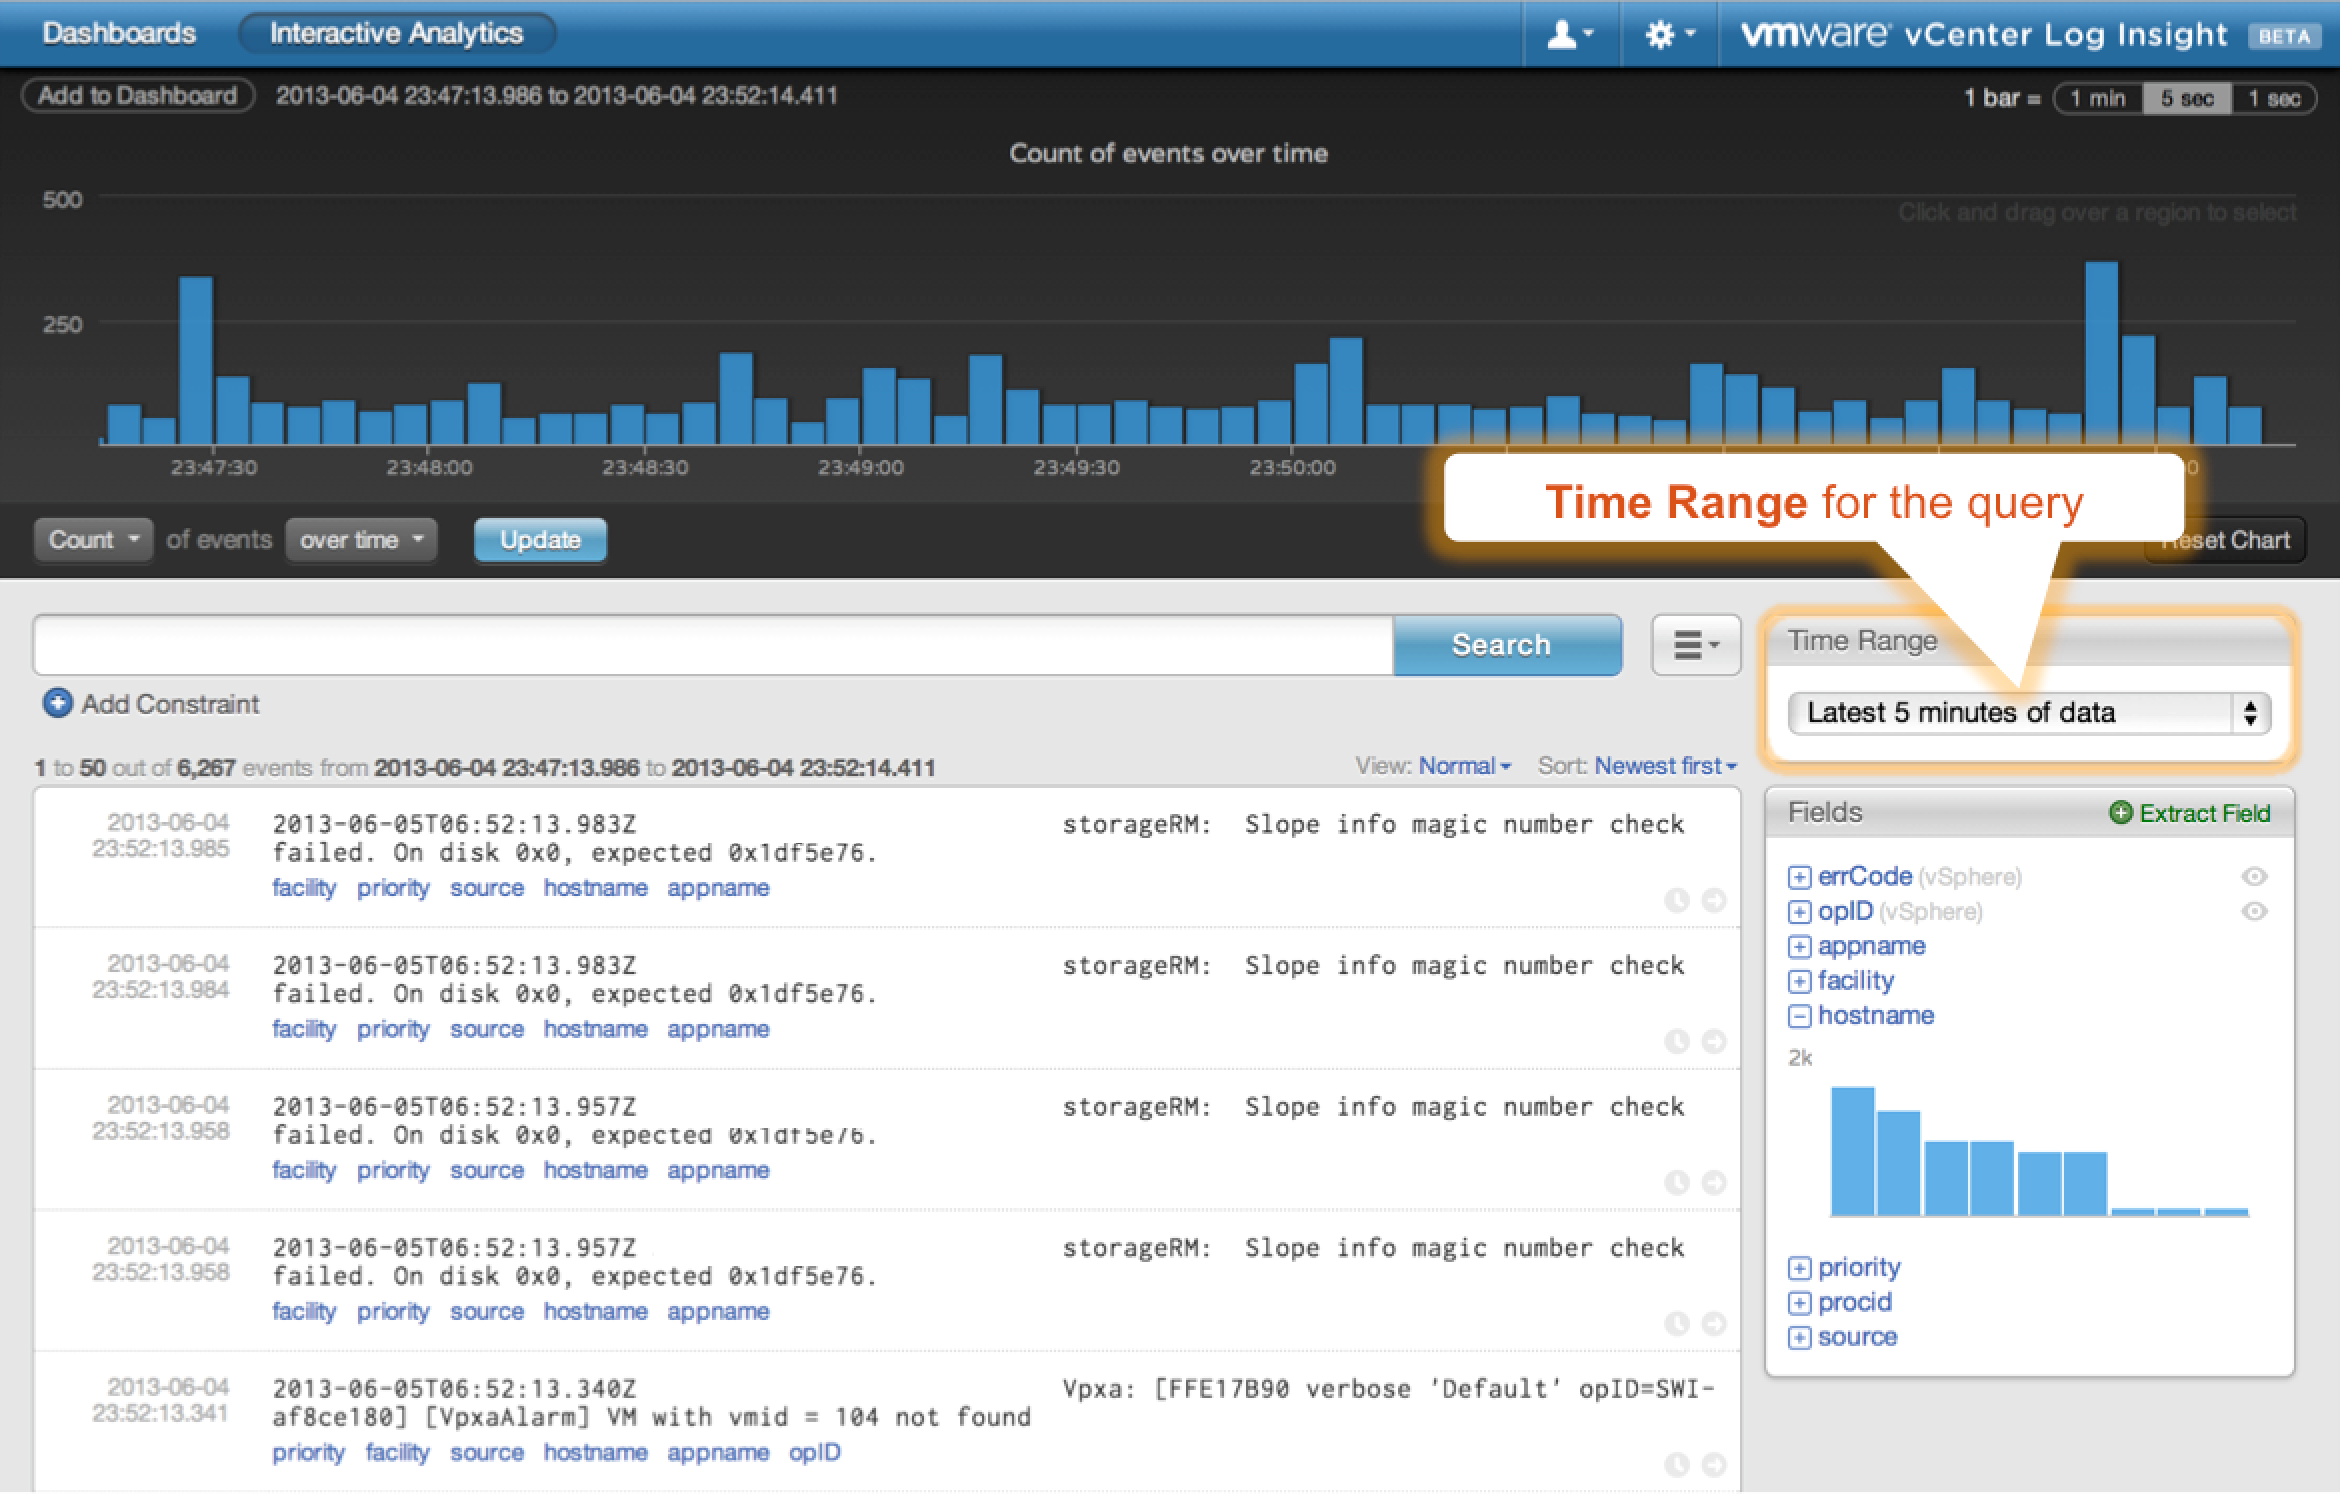
The time range is applicable to when Log Insight received log data – meaning unless no results are returned or a custom time range is defined, the chart widget will always be populated. This distinction is important because you may be wondering why you are seeing a gap in data in the chart widget.
Other Options
You will notice a menu drop-down to the left of the search bar:
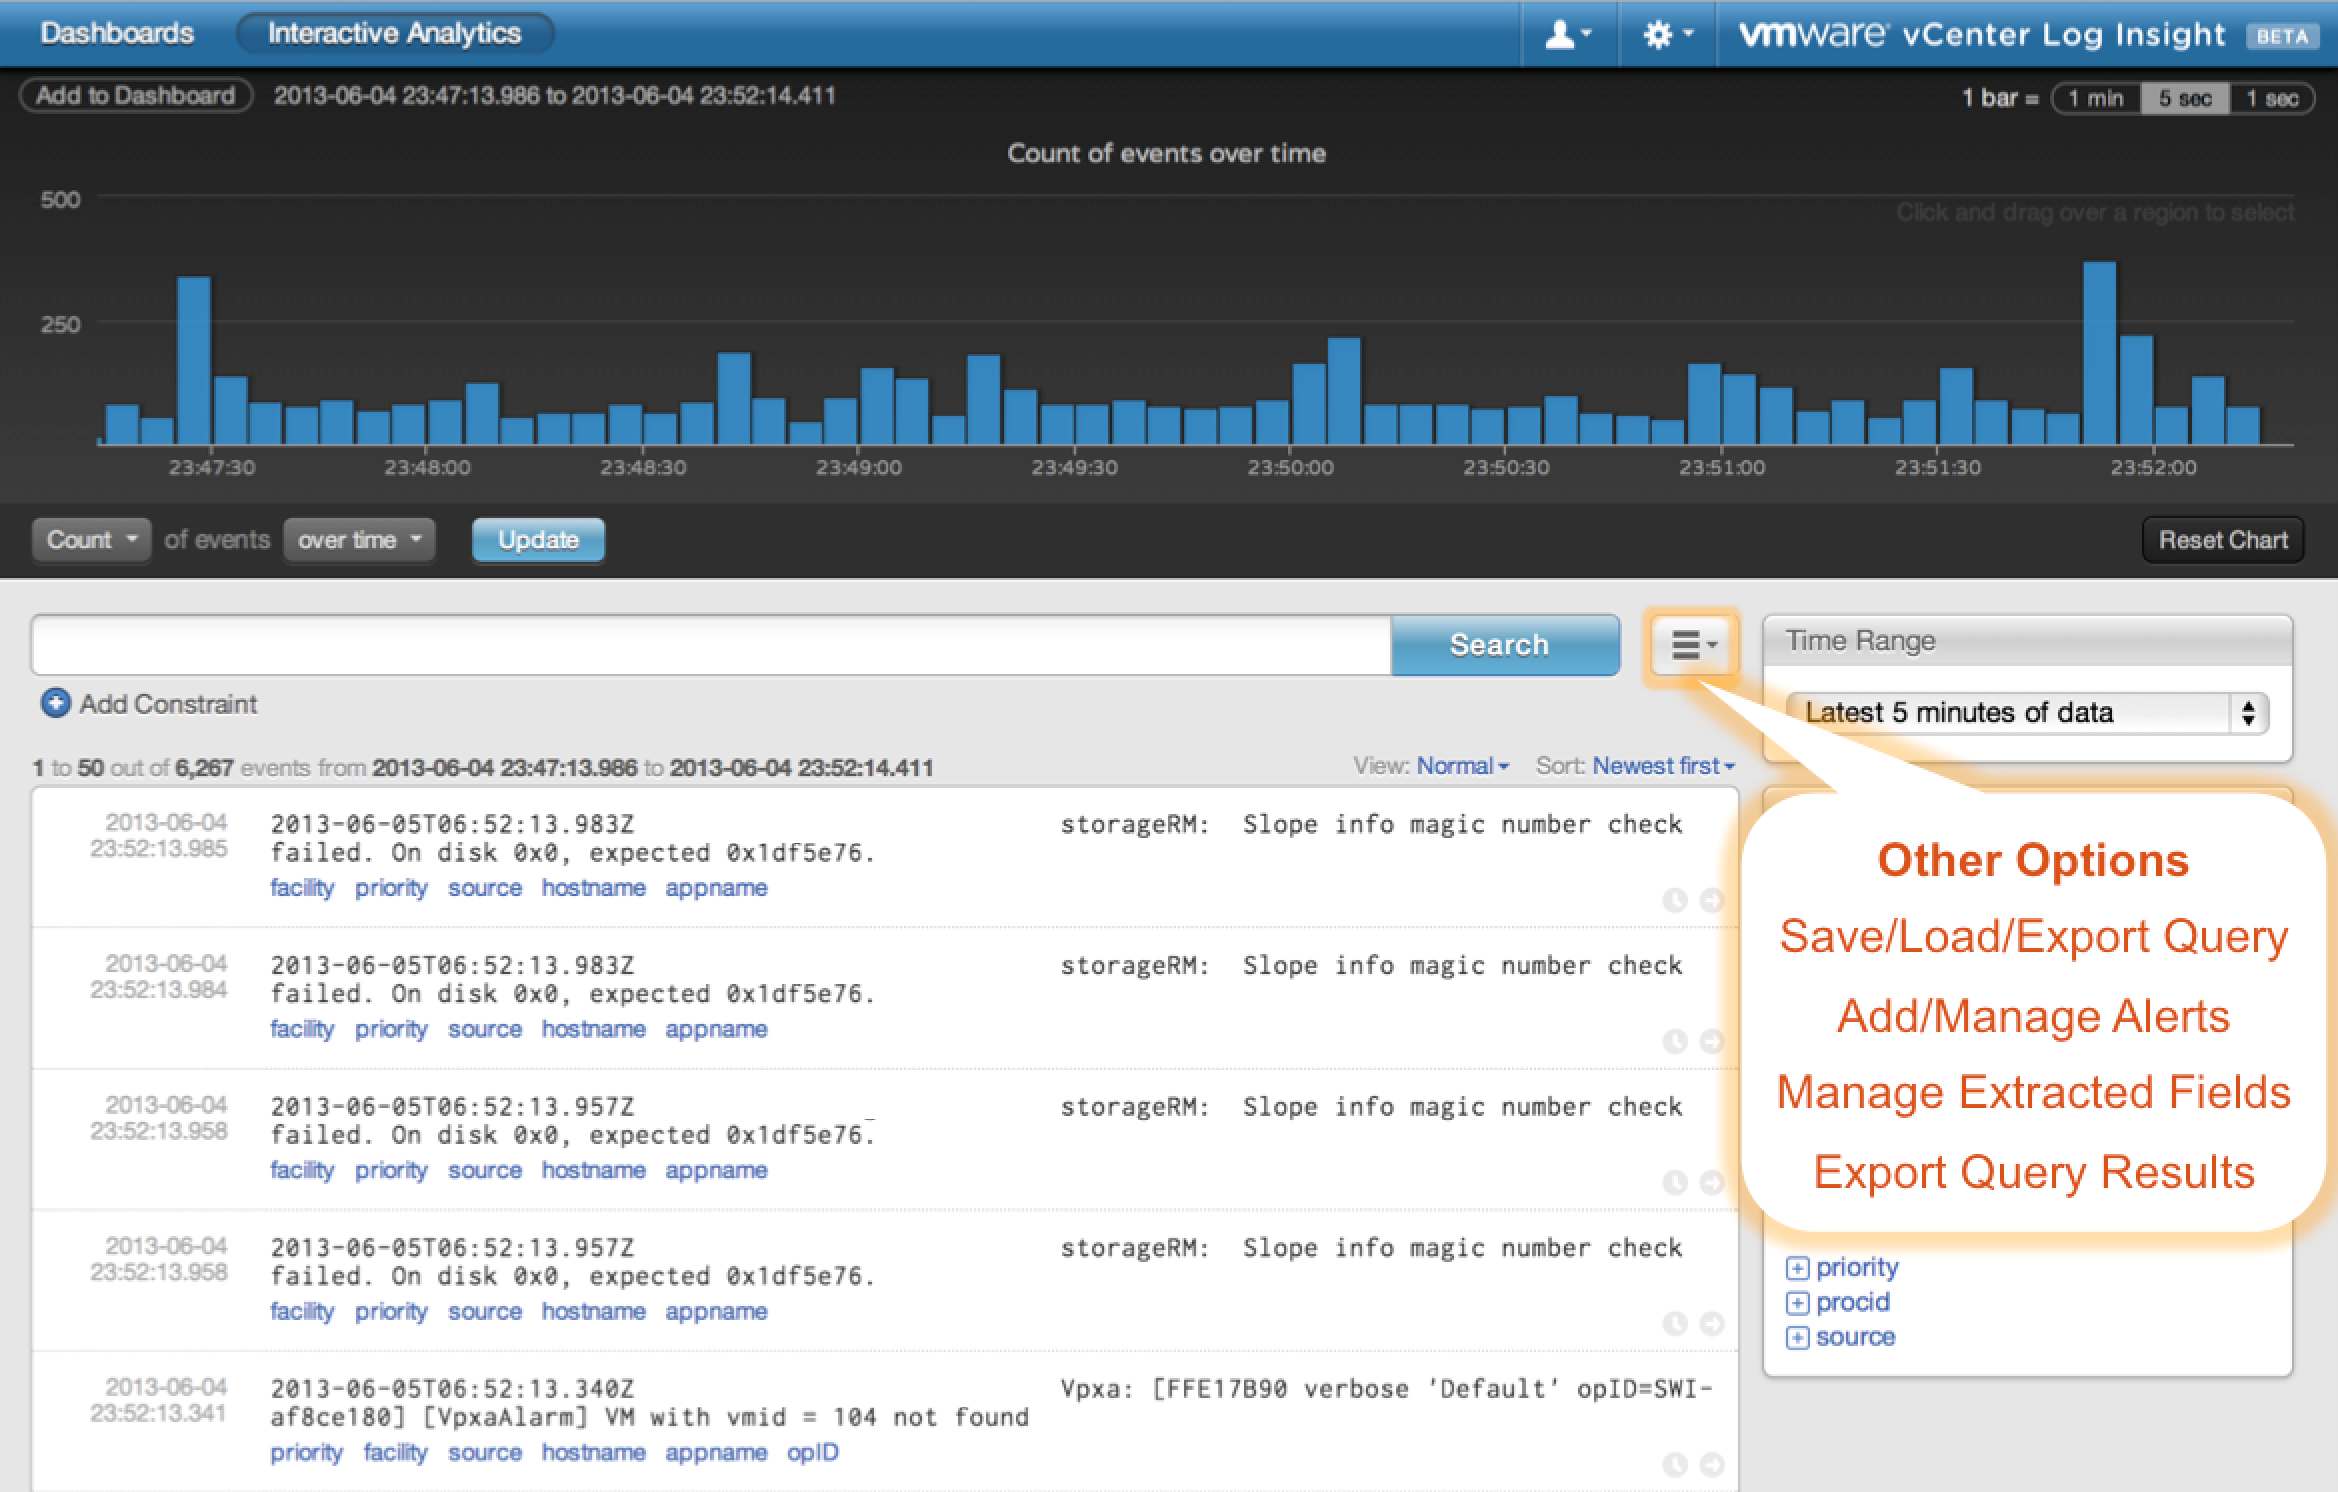
This menu drop-down contains links on how to perform other operations in the system including:
- Save/Load/Export Queries – In addition to saving a dashboard you can also choose to save a query.
NOTE: A saved query saves the time range in addition to the query. This is different then how all other pieces of information are saved in Log Insight (i.e. everything else you can save does not include the time range.)
- Add/Manage Alerts – When you find a query you care about you might want to configure an alert when that query returns one or more results. Log Insight allows for alerts to be sent via email or vCenter Operations today.
- Manage Extracted Fields – This is important if you wish to find an extracted field that does not appear on the current query page.
- Export Query Results – Once you run a query you can export the results of the query in either raw, JSON, or XML format.
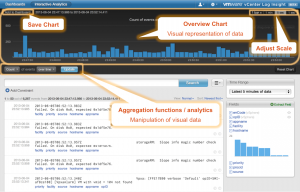
Overview
Now that you have seen the breakdown, looks have a look at the (mostly) complete picture:
© 2013 – 2021, Steve Flanders. All rights reserved.