
Log Insight features a couple of different types of alerts. In this post, I would like to cover user alerts and how thresholds work.

What is a user alert?
Everything in Log Insight is a query. A user alert in Log Insight is a query that runs on a schedule. You can think of it as a query that runs on a cronjob.
How to create a user alert?
On the Interactive Analytics page, construct a query you wish to alert on, select the alarm bell icon to the right of the search bar and select Create Alert from Query…
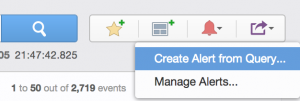
Alternatively, if you want to enable an alert you previously created or one defined in a content pack, navigate to the Interactive Analytics page, select the alarm bell icon to the right of the search bar and select Manage Alerts…, select the desired alert and enable as appropriate.
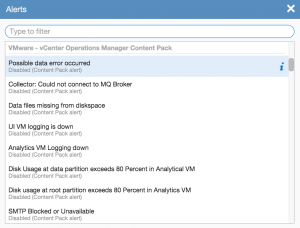
Note that content pack alerts get enabled within an individual user’s space and not globally to a Log Insight instance. Also, note that it is not possible to create shared alerts today though you could create a shared user account that multiple people have the credentials to in order to achieve the same effect.
Parts of a user alert
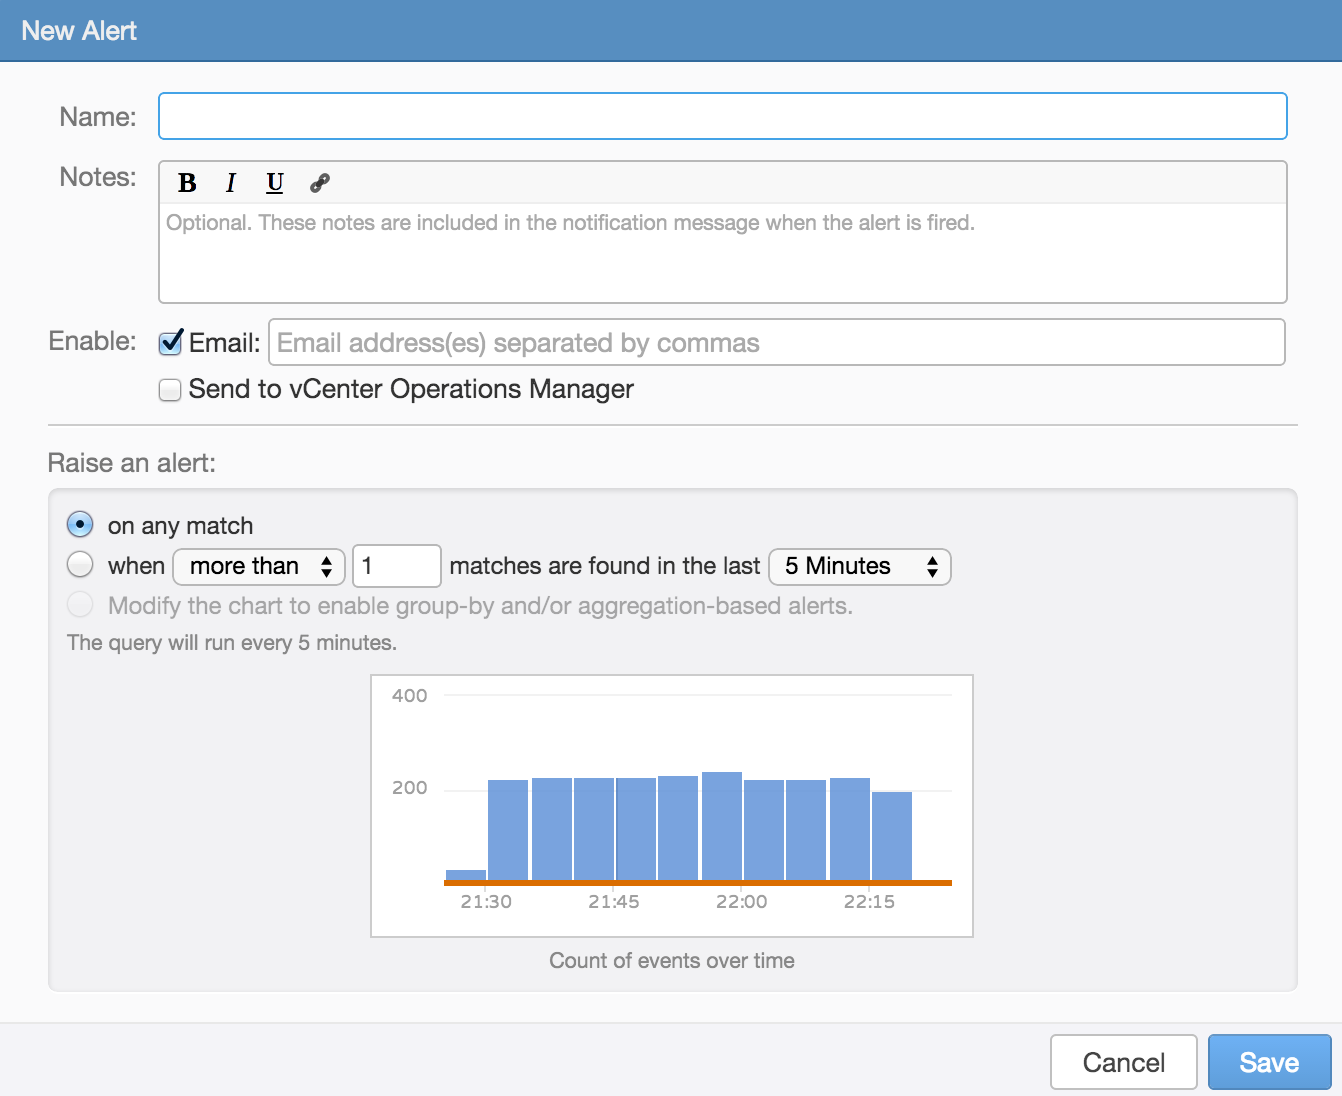
An alert is made of a variety of pieces including:
- Name – used in the subject of the email or vC Ops notification
- Description – used in the body of the email or vC Ops notification
- Enable – what the alert does when triggered
- Raise an alert (Threshold) – when and how often to alert
Note that the description can be very valuable and should include information about what the alert means and what action(s) need to be completed to resolve the issue.
Understanding thresholds
The most important part of a user alert, besides the actual query, is the threshold (i.e. raise an alert). Log Insight allows for two to three different types of thresholds depending on the type of query constructed:
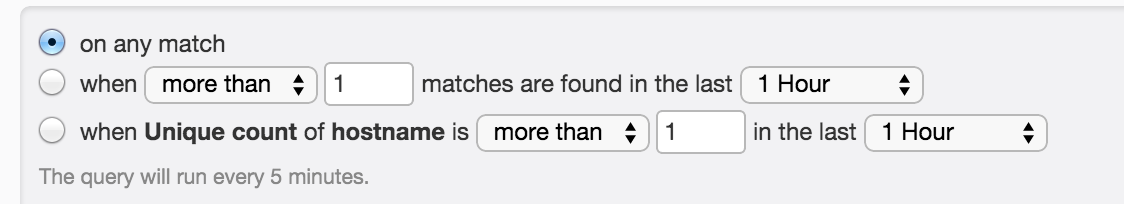
on any match
As the name implies, whenever any result is returned for the given query an alert will be triggered. This threshold should be used cautiously because if misconfigured may result in a large number of alerts being triggered.
The common use case for this threshold is when you need to know about a particular alert quickly and you want to notified about the issue every time. For example, in vSphere an All Paths Down (APD) state is a critical issue that requires immediate attention and while an APD situation may generate a lot of alerts when the issue occurs, the issue should occur very rarely (hopefully never).
when <more than|less than> <number> matches are found in the last <time range>
With this threshold, more/less than <number> results need to be returned for the given query over the set <time range>.
The common use-cases for this threshold is when you only want to be notified about a particular alert once for a certain amount of time or you only want to be notified if a result happens more/less than a set number of times. For example, in vSphere high SCSI latency greater than one second is something you likely want to be notified about, but if it continues to remain high, you likely only want to receive a single notification for a particular time range. As another example, the Synology content pack has an alert for bad sectors. A single bad sector is typically not cause for concern, but multiple bad sectors in a particular time range typically indicated a drive that is failing and should be replaced.
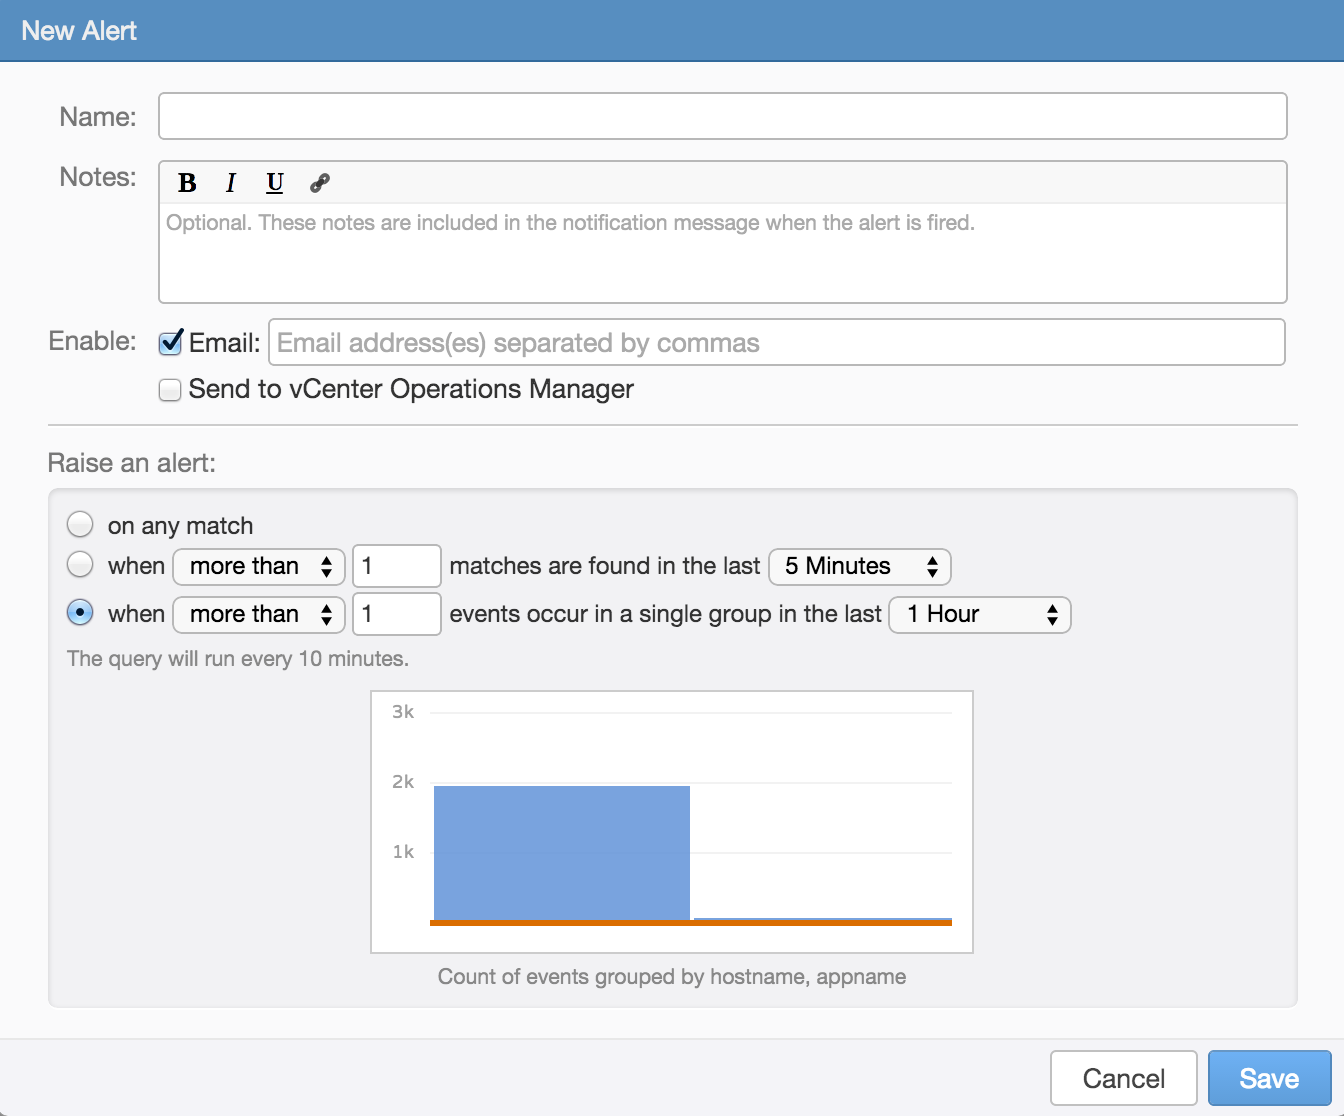
when <more than|less than> <number> events occur in a single group in the last <time range>
This threshold is only available if you construct a query that groups by (select over time drop-down) one or more fields. With this threshold, more/less than <number> results for a single grouping need to be returned for the given query over the set <time range>.
The common use-cases for this threshold is when you only want to be notified about a particular alert once for a grouping over a certain amount of time or you only want to be notified if a result happens more/less than a set number of times. For example, in vSphere high SCSI latency greater than one second is something you likely want to be notified about, but if you only look at the average SCSI latency across your entire environment then you might miss that a single datastore is experiencing latency above the value you care about.
Chart
At the bottom of the threshold section is a chart that shows the results of the alert query with an orange line which indicates if the alert would have triggered. This chart is helpful in ensuring your alert only triggers when desired.
In the above example, you can see that the alert would trigger every time if enabled. This is likely not the desired result unless the issue really is reoccurring in which case the issue needs to be resolved to prevent future alerts.
User alert query run time
In addition to when an alert will trigger, it is important to understand when an alert query will be run. You will notice below the three radio buttons for raise an alert that there is some text that says something like: This query will run every 5 minutes. This means that every 5 minutes the query defined in the alert will be run over the <time range> defined (for on any match the <time range> is latest 5 minutes of data). If results are returned above the defined threshold then the alert will trigger.
The alert query run time will vary depending on the <time range> defined (applies to second and third radio buttons only):
Note that the alert query run time is not settable at this time.
User alert query threshold time
One very important thing to understand about the <time range> is that it defines the <time range> for the alert query and the threshold time for how often the alert will trigger. For example, if the <time range> is set to the last 1 hour, then the alert query will be run over the last hour, and if the threshold is met the alert will fire and then not run again until 1 hour has passed. In short, you will receive a maximum of one alert for the given alert query within a 1 hour period though if the alert does not trigger then it may run up to six times in an hour (10 * 6 = 60). See the example section below for more information.
User alert example
In order to better understand how user alerts and thresholds work, let me walk through a real example. In the EMC – VMAX content pack there is an alert for “Thin pool utilization exceeds 80%”:
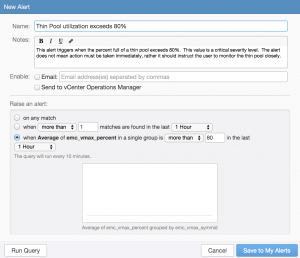
As you can see, it is defined to trigger if any VMAX has an average thin pool utilization above 80%. The threshold has been set to one hour and below the threshold, you can see the query runs every ten minutes.
Let’s assume you enable this alert at 11:50 am on a LI instance that is monitoring a single VMAX called VMAX 1. This means at 12:00 pm the defined query will be run with the time range for the query defined as one hour (i.e. 11:00 am to 12:00 pm). Let’s assume the average utilization for VMAX 1 is 75% and as such, no alert is triggered. At 12:10 pm the same query is run over the last one hour (i.e. 11:10 am to 12:10 pm). This means the second time and subsequent times the query is run only ten minutes’ worth of new data is checked, but the comparison is done for the last hour.
Let’s assume the average utilization for VMAX 1 in the last ten minutes (i.e. 12:00 pm to 12:10 pm) was 100%, will the alert trigger? The answer is likely no because the query average is computed over the last hour and not the last ten minutes so assuming the average utilization for the last ten minutes (i.e. 12:00 pm to 12:10 pm) was 100% and the average utilization for the previous 50 minutes (i.e. 11:10 am to 12:00 pm) was 75% then the average utilization for the last hour (i.e. 11:10 am to 12:10 pm) would be just over 79%, which is less than 80%.
On the third check, at 12:20 pm, let’s assume that the average utilization for the last hour (i.e. 11:20 am to 12:20 pm) was over 80% and as such the alert triggered. Now that the alert has triggered, it will silence itself for one hour (the threshold for the alert). This means the alert query will not run again until 1:20 pm and will look over the last hour of data (i.e. 12:20 pm to 1:20 pm). If the utilization is still over 80% it will alert and silence again (until 2:20 pm), otherwise, it will perform no action and run again at 1:30 pm.
Summary
User alerts in Log Insight are a powerful way to get notified about issues within your environment that you care about. Besides the actual query used in the user alert, the defined threshold is very important. The threshold determines how often a user alert query runs, over what time range a user alert query runs when a user alert query triggers, and how often a user alert query triggers.
© 2014 – 2021, Steve Flanders. All rights reserved.
Thanks for the detailed write up. Best one I have seen!
Glad you found it useful!
Hello Steve,
I am working on one scenario where, i am able to filter a particular log. have enable alerting to send a email notification. But can see it is not working. Request your support on fixing this issue.
log insight is of older version. 3.0 .
Getting system notifications for the same. so no issues with SMTP configuration.
Hey Aruna — I am no longer at VMware and Log Insight 3.0 is no longer supported. I would advise your upgrade and contact support. With that said, if the query works on IA, but not from the alert then this likely means either the threshold is wrong (you can check by editing the alert and viewing the chart) or something is wrong with alerts (you can check the logs in the virtual appliance). I hope this helps!