
From time-to-time, I receive a question asking what the current retention period is for a LI instance. In this post, I will discuss how Log Insight handles retention and how you can determine the current retention period.
![]()
System Alert
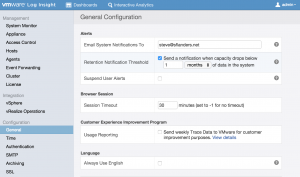
Log Insight monitors the retention period of your instance automatically via a system alert. Assuming you have properly configured system notifications — by specifying an email address to receive the alerts — and SMTP so that alerts can be properly emailed, Log Insight will alert when the retention period is or will be under the configured retention threshold — defaults to 30 days. You can see and change the retention period notification under Administration > General.
Query
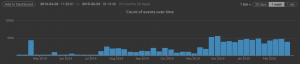
As long as the configured retention period is met, Log Insight does not care what the retention period is and will keep events until the configured virtual disk(s) is/are near capacity. If you wish to see what the current retention period is from the UI, the easiest way is to go to Interactive Analytics and run a query over all time. The bar chart at the top of the screen will indicate the first and last events as well as everything in between. Be sure to look to right of the Add to Dashboard button to see the exact time range.
Statistics
You may be wondering if the statistics information available from Administration > System Monitor > Statistics contains retention information. It does not. Again, Log Insight only cares if it is maintaining the defined retention period. However, the statistics page can be used to estimate the previous/future retention period as it provides information about the current ingestion rate. Assuming the current ingestion rate remains fairly consistent over time and looking at my Log Insight calculator makes it easy to estimate:
Formula: / ( * ( * 1e-12 ) * 60 seconds in a minute * 60 minutes in an hour * 24 hours in a day * 1.7 overhead ) =
Example: 1 TB of disk capacity / ( 10,000 events per second * (200 bytes * 1e-12) * 60 seconds in a minute * 60 minutes in an hour * 24 hours in a day * 1.7 overhead ) = 3.4 days of retention
CLI
A final way to check your retention period is to run a command from the CLI, which will return the first and last buckets in the system which will indicate the time range of events — note this is not exact as the oldest bucket timestamp will be the last time the bucket was written to not the time the bucket was created:
# ls -ltr /storage/core/loginsight/cidata/store | egrep '[a-z0-9-]{32}' | head -n 1; ls -ltr | egrep '[a-z0-9-]{32}' | tail -n 1
drwxr-xr-x 4 root root 4096 Apr 16 2014 a4e4f1cd-31a3-43c7-a144-140b17bfd61c
drwxr-xr-x 4 root root 4096 Feb 23 11:25 47528336-5d1e-4d1e-a997-8050533c6743
Summary
Log Insight makes it very easy to ensure you meet a minimum retention period through the use of system alerts. If you are looking for current retention information you can determine this a variety of ways including current ingestion rate, an all time query, or a CLI check of repository buckets.
© 2015, Steve Flanders. All rights reserved.
I’d like an option for SNMP and/or add it to the vRealize Ops integration so that an alert is logged there when the retention threshold is breached.
Hey Rob — Thanks for the comment! Do you just want SNMP for the retention threshold system notification? I would highly recommend opening a feature request in the community: https://loginsight.vmware.com.
SNMP for all system alerts would be useful. I’ll check out the community. Thanks.