
I have been hearing a few questions around the Log Insight system architecture and more specifically how it works. This week, I would like to walk through a few different parts of the architecture to clear up potential questions. Part 1 of this series will talk about the pipelines Log Insight uses.
![]()
Note: All information in this post comes from a 2013 VMworld Session on Log Insight called: Deep Dive into vSphere Log Management with vCenter Log Insight
Architecture
Log Insight has two primary pipelines:
- Ingestion — how events come into Log Insight, how they are processed and how they are stored
- Query — how events can be returned and through what interfaces
For both pipelines a series of threaded pools backed by bounded queues are established to handle the different stations in the pipeline. An EXTREMELY simplified way to view the architecture would be something like this:
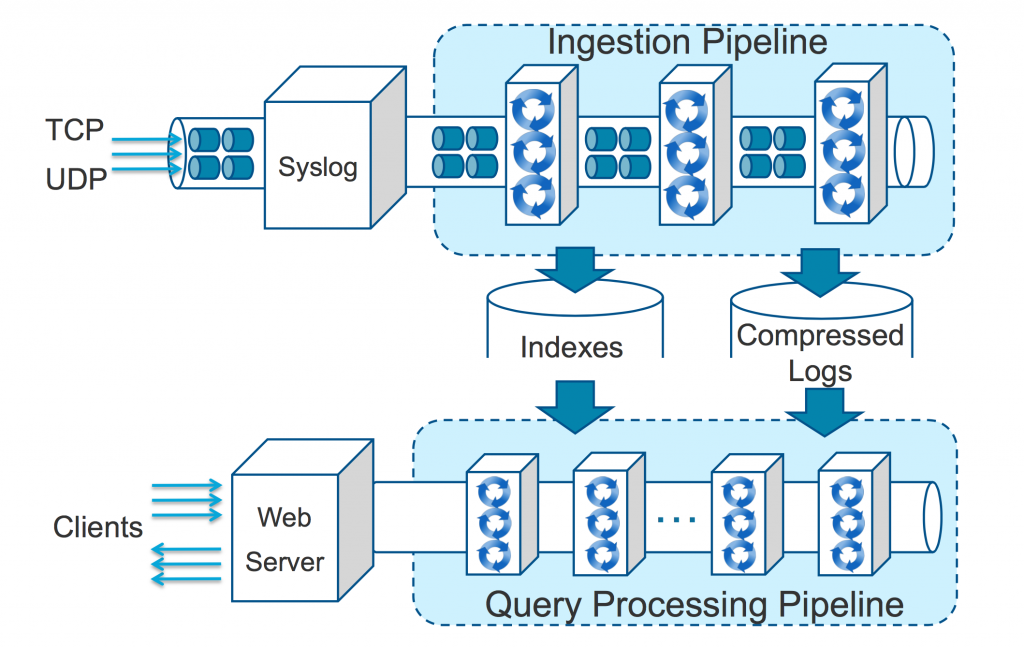
Note: Again this is a very simplified version of the pipelines. The input is applicable to the ingestion API as well as syslog. The query is applicable to alerts and machine learning in addition to UI requests.
Next up, let me walk through each pipeline.
Ingestion Pipeline
In the ingestion pipeline a variety of steps must be performed including:
- Accepting the event into the pipeline
- Creating/Updating the keyword indexes
- Storing the compressed logs
- Performing some of the machine learning functionality
Note: The keyword index is critical for optimizing query performance. I have a four-part series on query building, which can be found here.
As mentioned earlier, every step of the pipeline consists of a bounded queue should a step be backlogged for whatever reason. Assuming the bounded queue is full, back pressure would then be applied against the previous step’s bounded queue. When all queues are full then a bounded memory queue is used. When the bounded memory queue gets full then a bounded disk-backed queue is used. Finally, if all queues are full then events get dropped. Furthermore, Log Insight can put back pressure on the clients when the pipeline is experiencing serious back pressure which provides yet another queue. This means if you sized Log Insight properly then you can withstand even unexpected spikes in the ingestion rate for a good amount of time before drops would be experienced allowing you to dynamically address the issue if desired.
In regards to the data stored on disk, the indexes and compressed data are stored in a proprietary, no-sql-like format optimized for performance. The location of the data is:
/storage/core/loginsight/cidata/store
Now you may also recall that Log Insight uses Cassandra. Cassandra is used to store user and configuration data today, but not ingested events.
Query Pipeline
While the query pipeline is made up of steps as well, the threaded-queues work a little different. In the case of queries, a variable number of threads can be spun depending on the query type and the amount of queries in the queue. In the case of query processing, the number of queries is based on the number of CPUs available to the system — the more CPUs the more concurrent queries. This is why Log Insight recommends a minimum of medium-sized nodes in a production environment and for high, especially concurrent, query environments large-sized nodes.
Note: For production environments, medium or larger sized Log Insight nodes should be used.
It is also important to note that the number and types of queries impacts the ingestion rate of Log Insight. When sizing Log Insight, the metric is based entirely on ingestion rate and the recommended resources factors in a relatively high query load. This means for low query environments a higher than published ingestion rate is possible — though the recommendations should always be followed.
Finally, it is important to note that Log Insight will query over the data as well. For example, machine learning needs to look over data from time to time to perform schema discovery and the cache needs to be primed to optimize performance of queries executed.
Summary
As you can see, Log Insight has a sophisticated system architecture to ensure scale, performance and reliability. While this post merely scratches the surface of how the Log Insight backend works, hopefully it provides some clarification on what types of processing is done as well as how events are stored and used. In my next post, I will cover the system architecture around retention.
© 2015, Steve Flanders. All rights reserved.