Another important section in the Log Insight web UI is the administration section. The administration section provides health information as well as allows for the modification of configuration settings. All information displayed during the initial configuration wizard of the product can be modified from the administration section.
I would like to cover all aspects of the administration section that are not configurable during the initial configuration wizard.
Administration
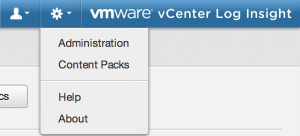
To get to the administration section, select the gear icon in the navigation bar and select administration.

NOTE: You will only see the administration option if you are an Admin user.
Health
The default administration page you land on is the health page. The health page is broken up into three separate sections outlined below.
System Info
The system info tab provides you with information about CPU, memory, disk, and networking. A few important items to understand in this tab:
- Live Storage Space – very common for this to be close to full indicating that old data is being retired (FIFO).
- Archive Storage Space – this should never be full and is the administrator’s responsibility to ensure.
- Memory – while the memory chart is nice, it is typically not indicactive of any issue.
- CPU – anything over 90% for an extended period of time may indicate the need for additional CPUs.
- Networking – read-only view of current network settings. To change these settings, power down the virtual appliance and edit vApp Options.
- Generate Support Bundle – if you are experiencing an issue, it is a good idea to generate a support bundle and note the time of the issue as it will be requested by VMware support for troubleshooting purposes.

Active Queries
The Active Queries tab displays information about queries running or scheduled to be run in the system. If the table is empty then no queries were running or scheduled to be running when this tab was loaded. The query table is broken down into the following columns:
- Query – a unique identifier of the query. You will also notice an ‘i’ button to the right of the unique identifier, which will show the query that is being run.
- Time Spent – the time the query has been waiting (if applicable) + the time the query has been running.
- Queued – whether the query is running now (true) or waiting to run (false).
- Cancel – an option to stop the selected query, which can be useful for long-running queries.

Statistics
The Statistics tab informs you of statistics relevant to the system. This includes information such as the ingestion rate; number of dropped messages; and time since last restart, ingested event, or dropped event. In addition, an advanced statistics link is available to drill down even further. A couple important notes:
- Ingestion rate is important to ensure the appliance is sized properly to support the load.
- Dropped events are important as a dropped event typically means an appliance that is not sized appropriately or above a configuration maximum.

Users
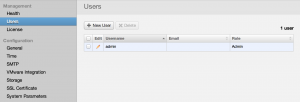
The users section provides information about the local user accounts that exist on the system. Please note that this section is specific to accessing the web UI. In terms of roles, there are two today:
- Admin – has access to everything.
- Normal Users – has access to everything except can only read shared dashboards and cannot access the administration section.
NOTE: Log Insight only supports local authentication today.
General
While some of the general configuration information is specified in the initial configuration wizard of the product, there are a few additional options in this section. These include:
- Enable Authentication – while Log Insight only supports local authentication, it also support a no authentication model if desired. This is useful for people who want to use a central authentication mechanism like Active Directory. Such an authentication device could be put in front of Log Insight and be leveraged instead of using the local authentication.
- Retention Notification Threshold – configuration for if/when retention system notifications should be sent.
- Suspend All Alerts – allows for all alerts, including system and user alerts, to be suspended. This can be helpful when alerts are spamming recipients. It is important to unselect this option during normal system operation, otherwise system notifications will not be received.

SSL Certificate
The SSL certificate section allows for changing the default, self-signed, VMware SSL certificate with a user specified certificate. The certificate uploaded must follow some strict requirements. These include:
- The certificate file contains both a valid private key and a valid certificate chain.
- The private key is generated by the RSA or the DSA algorithm.
- The private key is not encrypted by a pass phrase.
- If the certificate is signed by a chain of other certificates, all other certificates are included in the certificate file that you plan to import.
- All the certificates and the private key that are included in the certificate file are in the PEM format.
- Log Insight does not support DER-encoded certificates and private keys.
- Log Insight does not support certificates in the PFX, PKCS12, PKCS7, or other formats.

IMPORTANT: The private key must be in RSA format or the upload will fail. To convert a private key to RSA format please run a command similar to: openssl rsa -in loginsight.key -out loginsight_pem.key -outform PEM
System Parameters
The System Parameters section provides the ability to tweak advanced settings for the product. These settings should not be changed unless requested by VMware support. They are exposed in the web UI so a user does not need to log into the virtual appliance and manually edit configuration files.

© 2013 – 2021, Steve Flanders. All rights reserved.


