
I have received several reports of a blank/white page when viewing some of my posts. I have finally tracked down the issue and wanted to share my findings!
What was happening?
Typically after posting a blog entry, a few people would report that they would receive a blank/white page when viewing the link I posted. The frustrating part was that it always worked for me. Upon looking at the source of the page in question, no HTML would appear. The page was in fact empty.
What did the logs say?
A good first place to start troubleshooting is with log messages. I fired up my Log Insight instance and searched for my blog entry and found the following results:
Nov 8 12:10:37 10.15.1.28 apache: 172.16.1.8 - - [08/Nov/2013:12:10:36 +0000] "GET /2013/11/07/managing-fields-log-insight HTTP/1.0" 200 2283 "-" "Mozilla/5.0 (Macintosh; Intel Mac OS X 10.8; rv:22.0) Gecko/20100101 Firefox/22.0"
Nov 8 12:17:50 10.15.1.28 apache: 172.16.1.8 - - [08/Nov/2013:12:17:49 +0000] "GET /2013/11/07/managing-fields-log-insight HTTP/1.0" 200 403 "-" "Mozilla/5.0 (Macintosh; Intel Mac OS X 10.9; rv:22.0) Gecko/20100101 Firefox/22.0"
Well, HTTP status code 200 means the page was loaded successfully so what was going on?
How to reproduce the problem?
Before you even start looking at the logs you should be sure you can reproduce the problem, otherwise the logs may not be sufficient. I suspected the issue I was experiencing was cache related, but I needed to prove it. To test, I tried to access the URL in a Chrome incognito session. Upon doing so, I also received a blank/white page!
Now the problem seems simple, right?
Well not really. I am using both OS level cache and browser level cache on my blog. A common WordPress troubleshooting step is to disable plugins and see if doing so resolves the issue. The good news is I only have one plugin that handles caching in WordPress: Total Cache. I disabled the plugin and I was able to reproduce the problem without an incognito session.
So the good news is I found ways to reproduce the issue, I confirmed what the issue was, and I had a workaround. The bad news is that Total Cache is a very powerful WordPress plugin and I was not willing to disable it or change to a different plugin. So off to Google I went trying to find the issue and the resolution.
A came across this forum and turns out the problem has to do with a lack of ending slash ‘/’ in a URL. If you go to https://sflanders.net/2013/11/07/managing-fields-log-insight/ first the page would always load, but if you go to https://sflanders.net/2013/11/07/managing-fields-log-insight first it would not. This means that one potential workaround is to edit the apache configuration or add a .htaccess file that would check for and it missing adding an ending slash. Such a configuration might look like:
# Add trailing slash
RewriteCond %{REQUEST_FILENAME} !-f
RewriteRule ^(.*)([^/])$ /$1$2/ [L,R=301]
So why was I unable to reproduce the issue without an incognito session?
Total Cache has an option to not cache pages for a signed in user. Since I edited the blog entires in the same browser, but different tab from where I viewed the content, I never hit the cache issue.
How could I monitor for such an issue in the future?
Once I was able to reproduce the issue, I went back to the logs to see if there were any differences when the page loaded versus when it was blank.
When the page loaded, I received logs like the following:
Nov 8 12:10:37 10.15.1.28 apache: 172.16.1.8 - - [08/Nov/2013:12:10:36 +0000] "GET /2013/11/07/managing-fields-log-insight HTTP/1.0" 200 2283 "-" "Mozilla/5.0 (Macintosh; Intel Mac OS X 10.8; rv:22.0) Gecko/20100101 Firefox/22.0"
When the page was blank, I received logs like the following:
Nov 8 12:17:50 10.15.1.28 apache: 172.16.1.8 - - [08/Nov/2013:12:17:49 +0000] "GET /2013/11/07/managing-fields-log-insight HTTP/1.0" 200 403 "-" "Mozilla/5.0 (Macintosh; Intel Mac OS X 10.9; rv:22.0) Gecko/20100101 Firefox/22.0"
What is the number after the HTTP status code?
Turns out that number indicates the page size. What I noticed was that if the number returned less than 1000 then the page was blank and when it was over 1000 the page loaded as expected.
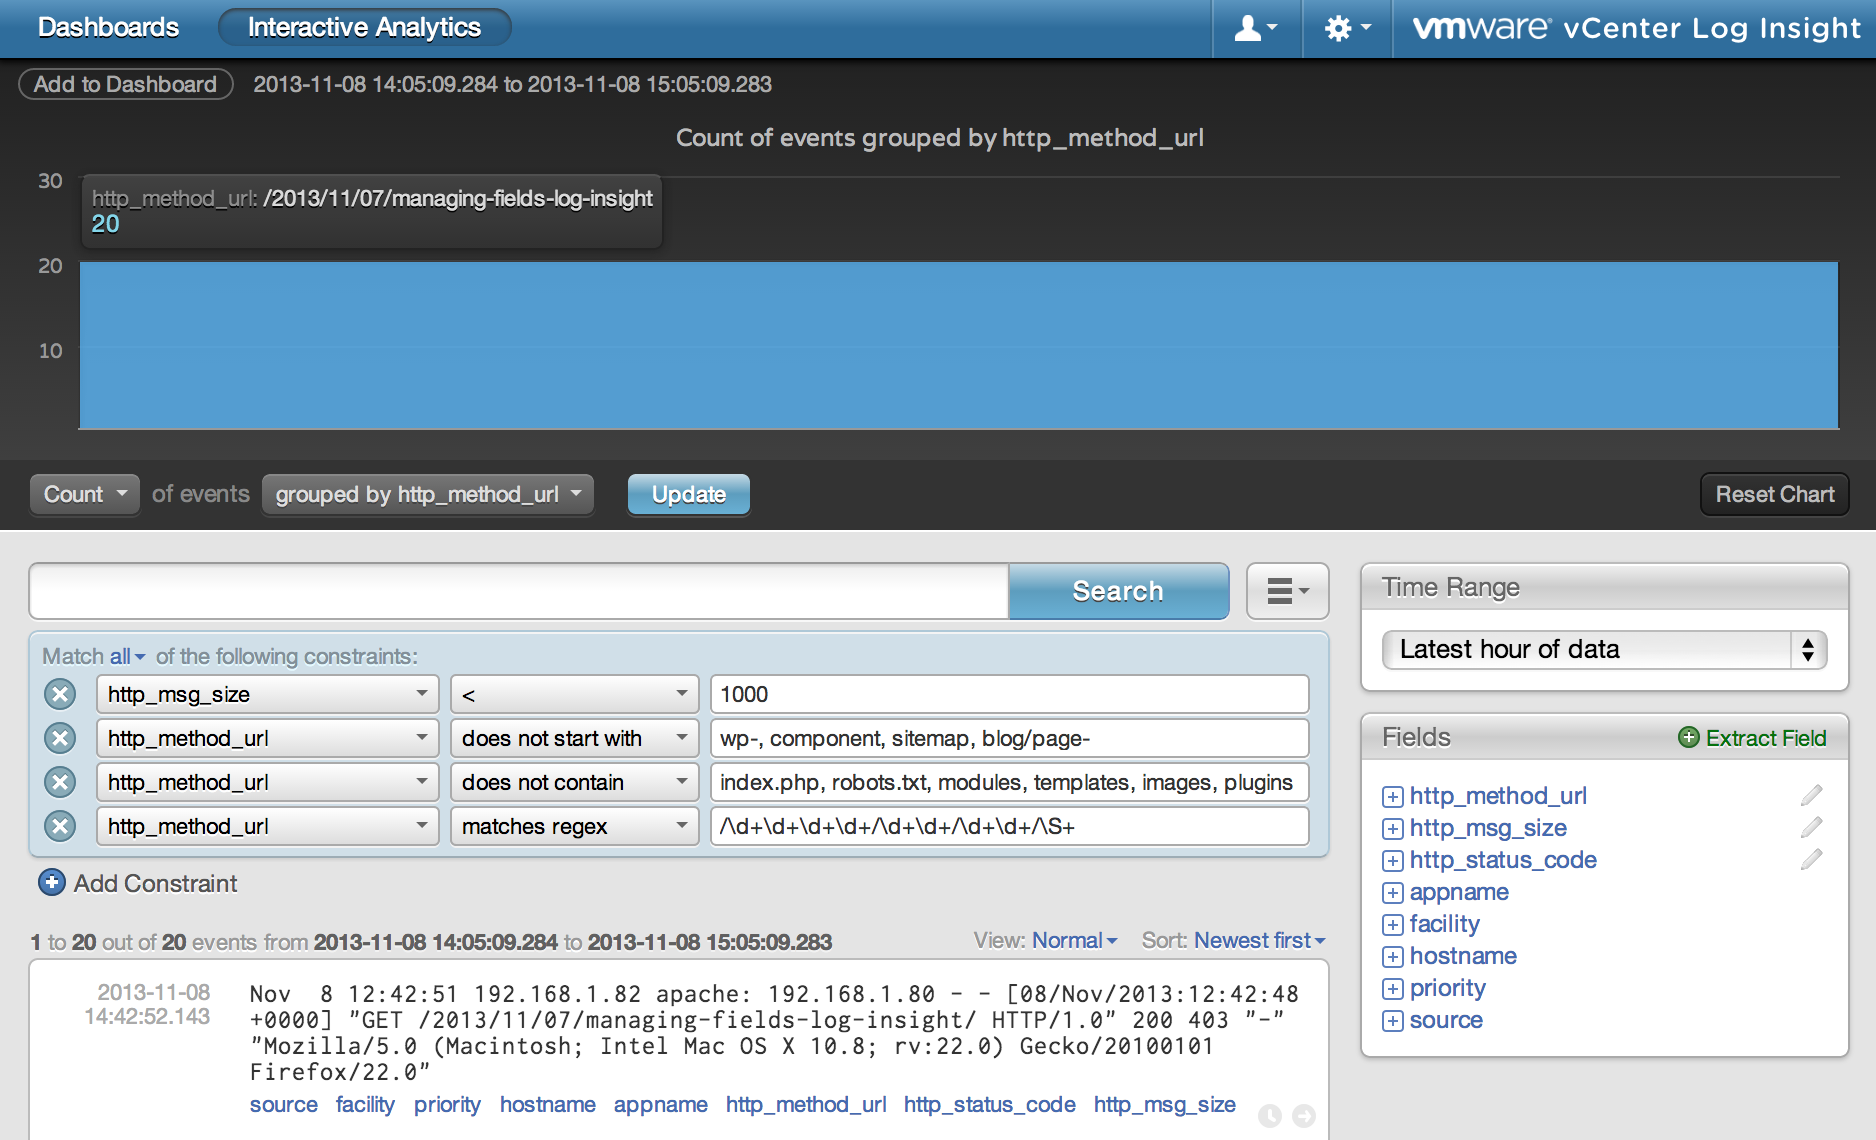
With this knowledge, I went back to Log Insight to construct a query for the issue. Here is what I came up with:
UPDATE: Looks like I forgot to add ‘trackback’ to the http_method_url does not contain constraint.
While the query is specific to my environment, it should be fairly straightforward to imitate. I simply extracted the URL, HTTP status code, and page size as fields and then searched for blog posts where the HTTP status code was 200, but the page size was under a 1000. The returned results were for the page that others had reported was not working.
With the query constructed I next created an alert as follows:

Now, every time the query matches I will receive an email letting me know. Here is what the email looks like:
Hi,
Log Insight just found the following 1 event matching the criteria for alert “WordPress White Page of Death!!!”:
Nov 14 15:42:11 10.15.1.28 apache: 172.16.1.8 – – [14/Nov/2013:15:42:10 +0000] “GET /2013/11/14/log-insight-properly-licensed/ HTTP/1.0” 200 403 “-” “Mozilla/5.0 (compatible; Googlebot/2.1; +http://www.google.com/bot.html)”
Additional notes for this alert:
People cannot load a page on your WordPress blog! This likely means that Total Cache is doing something stupid. Until this issue can be tracked down, go to the Performance > Dashboard page and select the empty all caches link.
For more details, please view the search results.
To make changes to this alert, please visit the alert page.
Whenever I receive this email I simple empty all caches in Total Cache and load the page to ensure it caches properly. Pretty cool if you ask me!
© 2013, Steve Flanders. All rights reserved.