
I have heard many requests from people looking for how to configure an external load balancer (LB) to balance the traffic for a Log Insight cluster. This post provides directions for some popular LBs.
Terms
Here are a few important terms that will be used throughout this post:
- VIP = Virtual IP (where events should be sent)
- Pool = Log Insight cluster
- Node = Log Insight instance
- LB = Load Balancer
- SNAT = Source Network Address Translation
General
I covered high-level LB information during the Log Insight 2.0 beta here, but would like to reiterate the considerations as they are critical for LB configuration:
- UDP – assuming you are sending events over UDP (the standard for most systems today), you need a load balancer that supports UDP traffic.
- TCP – syslog TCP connections are often, what are referred to as, “long-lived” TCP sessions. This means unless the syslog process on the client is restarted or there is a network interruption between the client and the server, the client will establish and keep open a connection with the server (or in the case of a Log Insight cluster, a single node in the cluster). This can lead to cluster imbalances overtime (more on this in a future post).
- Algorithm – the default load balancer algorithm is typically round robin. To address potential load imbalance in the base of Log Insight node maintenance, using the least connections algorithm is recommended.
- Connections – it is important that the load balancer used is capable of supporting the number of connections required for your environment. For a full-scale cluster, some load balancers are not capable of handling the combination of the number of connections with the number of events sent per connection resulting in dropped messages.
- Throughput – syslog traffic is light and traffic for a full-scale cluster only pushes about 200MB/s. This rules out developer licenses for many load balancers.
- SNAT – while not specific to syslog traffic, it is important to note that unless the load balancer is also acting as a router that you will need to configure SNAT (Source NAT) for the traffic to be passed properly.
In regards to the configuration information listed below, I will be skipping information that is not about configuring the cluster. It will be important that you configure these as appropriate for your environment:
- High Availability (HA) – one of the reasons why you might choose to use a Log Insight cluster is for ingestion HA. I will not be covering how to configure HA on the load balancers listed in this post.
- Firewall rules (security) – for security reasons, you may wish to restrict which systems can talk to Log Insight. I will not be covering how to configure firewall rules on the load balancers listed in this post, but reference the Log Insight security guide for port/protocol requirements.
For each LB defined below the following sections may be used:
- Terms – specific to the LB being defined
- Manage – how to mange the LB being defined
- Deploy – how to stand-up a new instance of the LB being defined
- Change pool – you may need to make changes to the pool over time for things such as expanding/reducing the cluster size and handling cluster maintenance.
- Troubleshooting – tips and tricks on how to resolve issues
Finally, in terms of LB configuration it is important to understand the steps required:
- Deploy the LB
- Manage (log in) to the LB
- Perform initial configuration – as appropriate for your environment
- Define nodes – needs to be repeated for each node in a cluster
- Define pool – only one per cluster
- Add nodes to pool
- Define VIP – only one per cluster, but multiple protocols per VIP depending on environment requirements
- Add pool to VIP
- Verifications – ensure everything is green on the LB and ensure when sending traffic to VIP, Log Insight receives it
- Usage – point all devices to the VIP via FQDN
 vCNS
vCNS
Terms
- vCNS = vCloud Network and Security (aka vShield and soon to be NSX)
- vSM = vShield Manager
- vSE = vShield Edge
- VDS = Virtual Distributed Switch
Manage vSE
- Log into vShield Manager
- Expand Datacenters
- Select Datacenter for vSE
- Select Network Virtualization tab in right pane
Deploy vSE
- While on the Network Virtualization tab in right pane, select the green plus icon
- Give the vSE a name and enable/configure HA (outside the scope of this post)
- Select Next
- Configure CLI credentials as appropriate and select Enable SSH access if desired
- Select Next
- Under Edge Appliances leave Appliance Size unless running large Log Insight instance in which case select Quad Large
- Under Edge Appliances select the green plus
- Select Cluster/Resource Pool
- Select the Datastore
- Select Add
- Select Next
- Select the green plus for Interfaces
- For name enter Uplink
- Under Configure Subnets select the green plus
- Under Add Subnet select the green plus
- In the IP address dialog box, enter a static IP
- Select OK
- Enter the Subnet Mask
- Select Save
- Select Add
- Select checkbox to configure default gateway
- Enter gateway IP
- Select Next
- (Optional) Select Configure Firewall default policy
- For Logging select Enable
- Select Next
- Select Finish
- Double click VSE
- Under Details select Change
- In Syslog Server 1 enter the FQDN of the Log Insight instance to collect vSE logs
- Select Save
- Select the Configure tab
- Select the pencil
- Select Select
- Select Distributed Portgroup
- Select radio button
- Select Select
- Select Save
- Select the Load Balancer tab
- Select the green plus
- Enter a name for the pool
- Select Next
- Select the checkbox next to TCP and change the port to 514
- Select Next
- Change monitor port to 514 for TCP
- Select Next
- Select the green plus
- Enter IP address of a node and change monitor port to 514
- Select Add
- Select Next
- Select Finish
- Repeat above steps for all nodes
- Repeat above steps for TCP 9000, TCP 1514, and TCP 6514
- Select Publish Changes
- Select Virtual Servers
- Select the green plus
- Give the VIP a name
- Enter an IP address for the VIP (use the same as the interface you manually configured)
- From the Existing Pool drop-down select the pool to add to the VIP
- Under Services
- Select the checkbox box next to TCP and change the port to 514
- Add one for TCP port 9000, TCP 1514, and TCP 6514
- Scroll down and select the Enable logging checkbox
- Select Add
- Select Publish Changes
- Select Pools
- Select Enable
- Select Publish Changes
Change pool
- Access the Network Virtualization tab
- Double click VSE for which you want to update the LI Nodes
- Select the Load Balancer tab
- Select the pool and select the pencil icon
- Select Next
- Select Next
- Select Next
- Modify members as desired (add/remove/change master/workers)
- Select Next
- Select Finish
- Select Publish Changes
Troubleshooting
- From the Log Insight instance you are forwarding logs to, query for source contains <FQDN_or_IP> of vSM and/or vSE
 F5
F5
Manage F5
- Log into F5 (https://<FQDN_or_IP>) (admin/<password>)
- Local Traffic – where all VIP/Pool/Node/Monitors are configured
- Statistics – helpful for monitoring status and checking LB health
Create/Change nodes
- Follow the directions in the Manage F5 section above
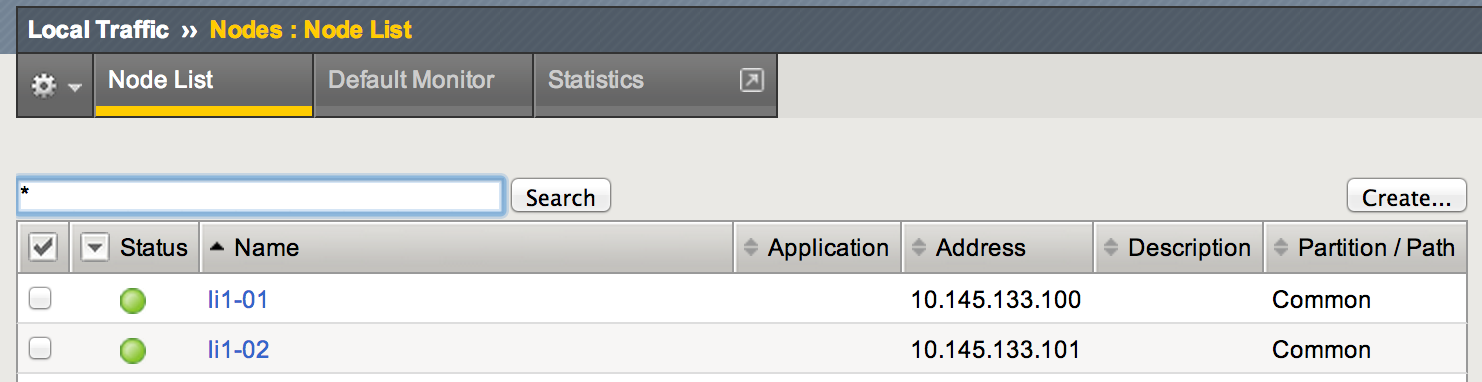
- Under Local Traffic select Nodes
- Select Create
- Enter name of LI instance
- Enter IP address of LI instance
- Select Repeat if you need to add more nodes else select Finished
Create/Change pool
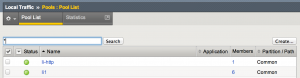
- Under Local Traffic select Pools
- Select Create
- Enter a name for the pool
- Under Health Monitors focus on Available, scroll down and select TCP
- Select the left arrow to move to Active
- Select Finished
- Under Members for the Pool select 0
- Select Add
- Under Address select Node List
- Select the node to add to the pool
- Under service port enter 514
- Select Repeat to add more nodes else Finished
Create VIP (Virtual Servers)
- Follow the directions in the Create/Change pool section above
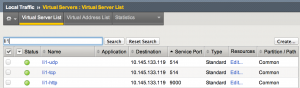
- Under Local Traffic select Virtual Servers
- Select Create
- Enter a name for the VIP – recommended format: <clusterName>-<tcp|udp|api> (e.g. li1-tcp, li1-udp, li1-api…)
- Enter Destination Address – should be unique per Log Insight cluster configured on LB
- Under Service Port enter: tcp=514, udp=514, tcp=1514, tcp=6514, tcp=9000
- Under Protocol, select the protocol desired (all TCP except UDP)
- If another protocol is needed select Repeat else select Finished (note: changing to UDP seems to fail so select Finished and then select Create for UDP)
- For each VIP, select Edit under Resources
- For Default Pool select the cluster Pool you created earlier (e.g. li1)
- Select Update
 Riverbed
Manage Riverbed
- Log into Riverbed (https://<FQDN_or_IP>:9090) (admin/<password>)
- Validate that all clusters to be tested are green on the Home tab
Create/Change virtual servers
- Select Services
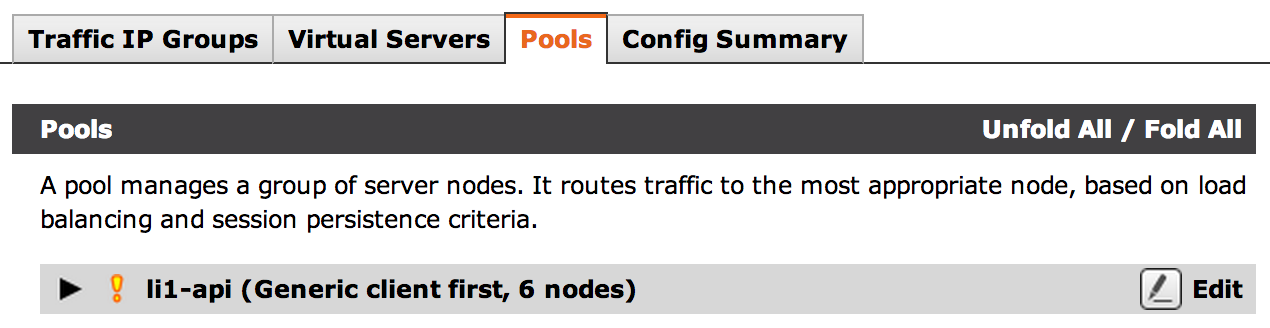
- Select Pools tab
- Scroll down to Create a new Pool
- Pool Name: <clusterName>-<protocol> (e.g. li1-udp)
- Nodes: Enter the IP address of each node for the protocol (api/tcp/udp all 6 nodes)
- Monitor: Connect
- Select Create Pool
- When you are done you should have 5 pools per cluster (api/tcp/udp) and each should have a green check mark
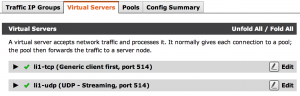
- Select Virtual Servers
- Scroll down to Create a new Virtual Server
- Virtual Server Name: <clusterName>-<protocol> (e.g. li1-udp)
- Protocol: api/tcp daemon/query = generic client first, udp = udp-streaming
- Port: api = 9000, tcp = 514, udp = 514, tcp = 1514, tcp = 6514
- Default Traffic Pool: <clusterName>-<protocol> (e.g. li1-udp)
- Select Create Virtual Server
- Under Basic Settings > Listening on: Select Traffic IP Groups and select the checkbox next to <clusterName> (e.g. li1)
- Under Basic Setting > Enabled: Select Yes
- Select Update
- When you are done you should have 5 virtual servers per cluster (api/tcp/udp/tcp[ssl-esxi]/tcp[ssl]) and each should have a green check mark
- Select Home
- Verify the virtual server is shown in green
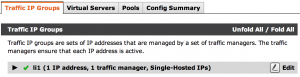
Create/Change traffic managers (VIP)
- Select Services
- Select Traffic IP Groups
- Scroll down to Create a new Traffic IP Group
- Name: <clusterName> (e.g. li1)
- IP Addresses: enter a static IP address
- Select Create Traffic IP Group
Troubleshooting
- How can I tell what clients are sending traffic to the LB – the issue is when using a LB the source field in LI becomes the LB
- Select Activity
- Select Connection tab
- Add a filter for what you are looking for (e.g. Virtual Server equal li1-tcp)
- Select Update filters
- Look at the From column
- How can I check the LB load?
- Select Activity
- From Current Activity under Settings, select a Chart data option
- If you do not like the Chart data options select Change data
- Select the fields you care about and give it a name
![]()
 Kemp
Kemp
Note: Kemp is the best choice of external load balancer for Log Insight 2.0 because it offers message rebalancing of events through a Log Insight specific add-on pack. No other external load balancer provider offers this functionality out of the box!
I could list all the steps here, but Kemp has done a great job putting together a document that covers all the steps here.
Others
This post demonstrates how to configure some common LBs to work with a Log Insight cluster. Other LBs, including HAproxy, NGINX, and Cisco ASA could be used as long as the Log Insight considerations are followed.
Note: if you need UDP load balancing and you are looking for an open-source/free alternative to HAproxy/NGINX since neither have UDP load balancing, check out Zen.
© 2014 – 2021, Steve Flanders. All rights reserved.