
One UI improvement in Log Insight 3.0 that I have not talked about is multi-function charts. Read on to learn more!
![]()
Log Insight has always supported aggregation queries (e.g. everything with a black background on the Interactive Analytics page). As you may recall, an aggregation function consists of a function and zero or more groupings with or without time. Well, in Log Insight 3.0 some improvements have been made.
First, for mathematical functions you now have the option of specifying one or more (use to be only one):
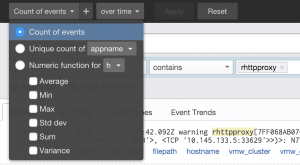
Second, you can now add another aggregation function to the same query (the option is one or two only today):
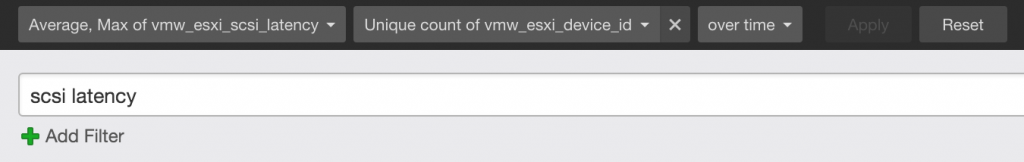
So what value do these enhancement bring? Well let’s say you wish to determine the average and maximum values in the same query/visualization — this is now possible:

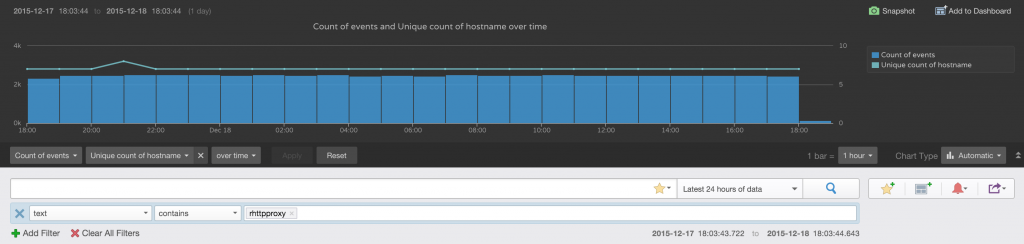
Or let’s say you want to determine whether an increase or decrease in unique clients has a positive or negative impact on the number of events being ingested — this is now possible:
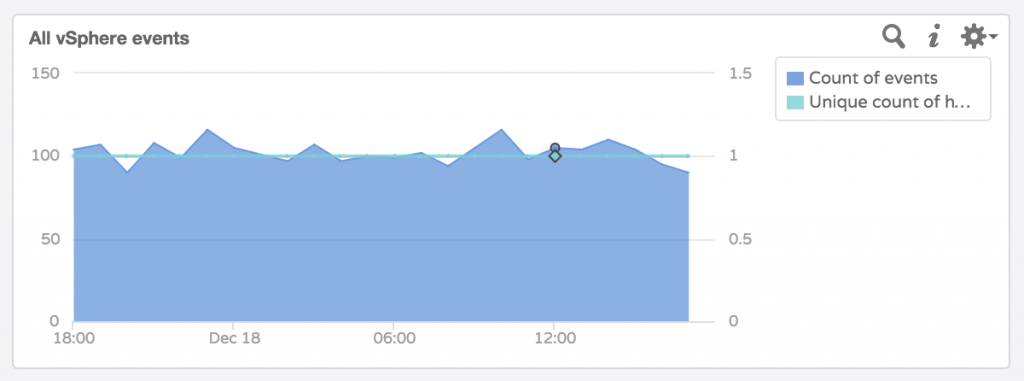
You will see these new visualizations being leveraged in the updated vSphere content pack as well:
Note: To be clear, the real value of these improvements focus around attempting to correlate two pieces of information from the same event. With some advanced queries it is possible to correlate two pieces of information from two different events, but this is not the primary use-case for these improvements.
© 2015, Steve Flanders. All rights reserved.