In this post, I would like to drill into the Log Intelligence home page. Read on to learn more!
Before We Begin
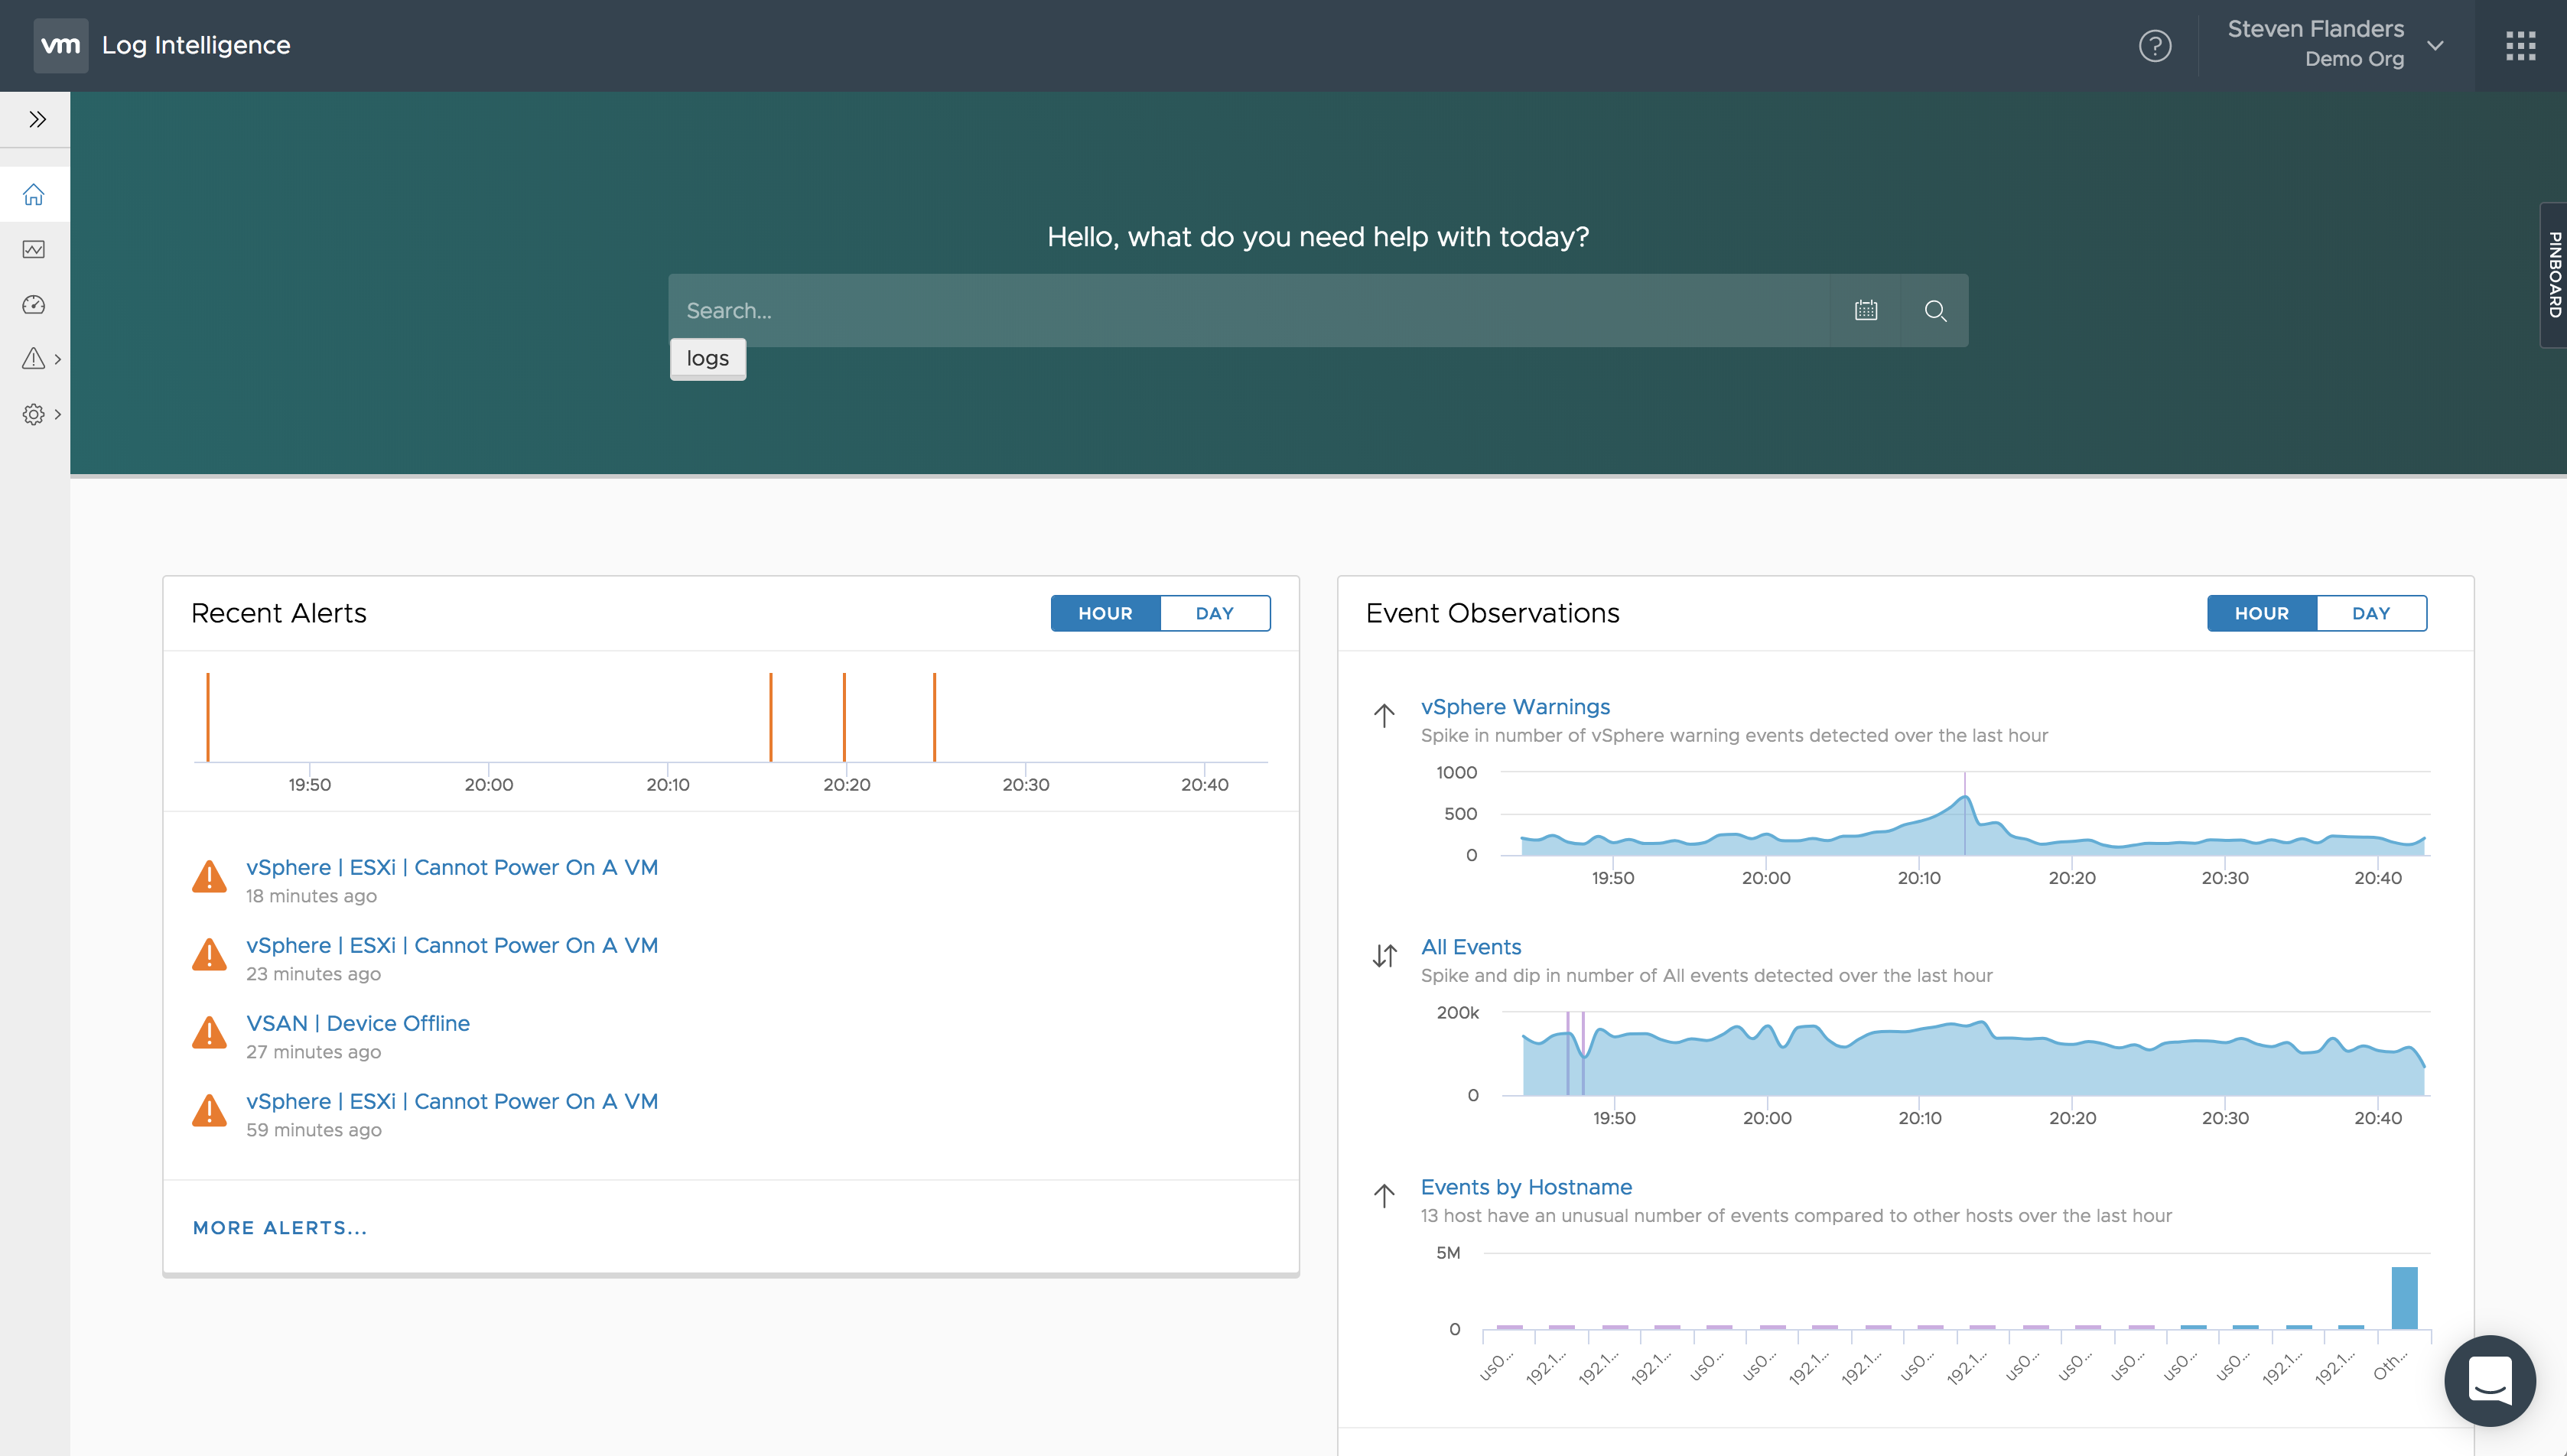
The home page on Log Intelligence features three things:
- Search Bar
- Recent Alerts
- Event Observations
Let’s walk through each of these.
Search Bar
The home page search bar in Log Intelligence is very powerful. As you would expect, it allows you to search for keywords and offers autocomplete. In addition to these expected features, it also offers two additional benefits:
- It has the ability to query over events and content
- It offers query assist capabilities
What do I mean? Let me explain.
Query over Events and Content
Well, let’s say you want to check the VSAN health of your environment. If you enter “vsan health” in to the search bar:

you would expect it to search for events ingested that contains the keywords “vsan” and “health”, but in addition Log Intelligence will query over relevant built-in content like that found in the VSAN queries:
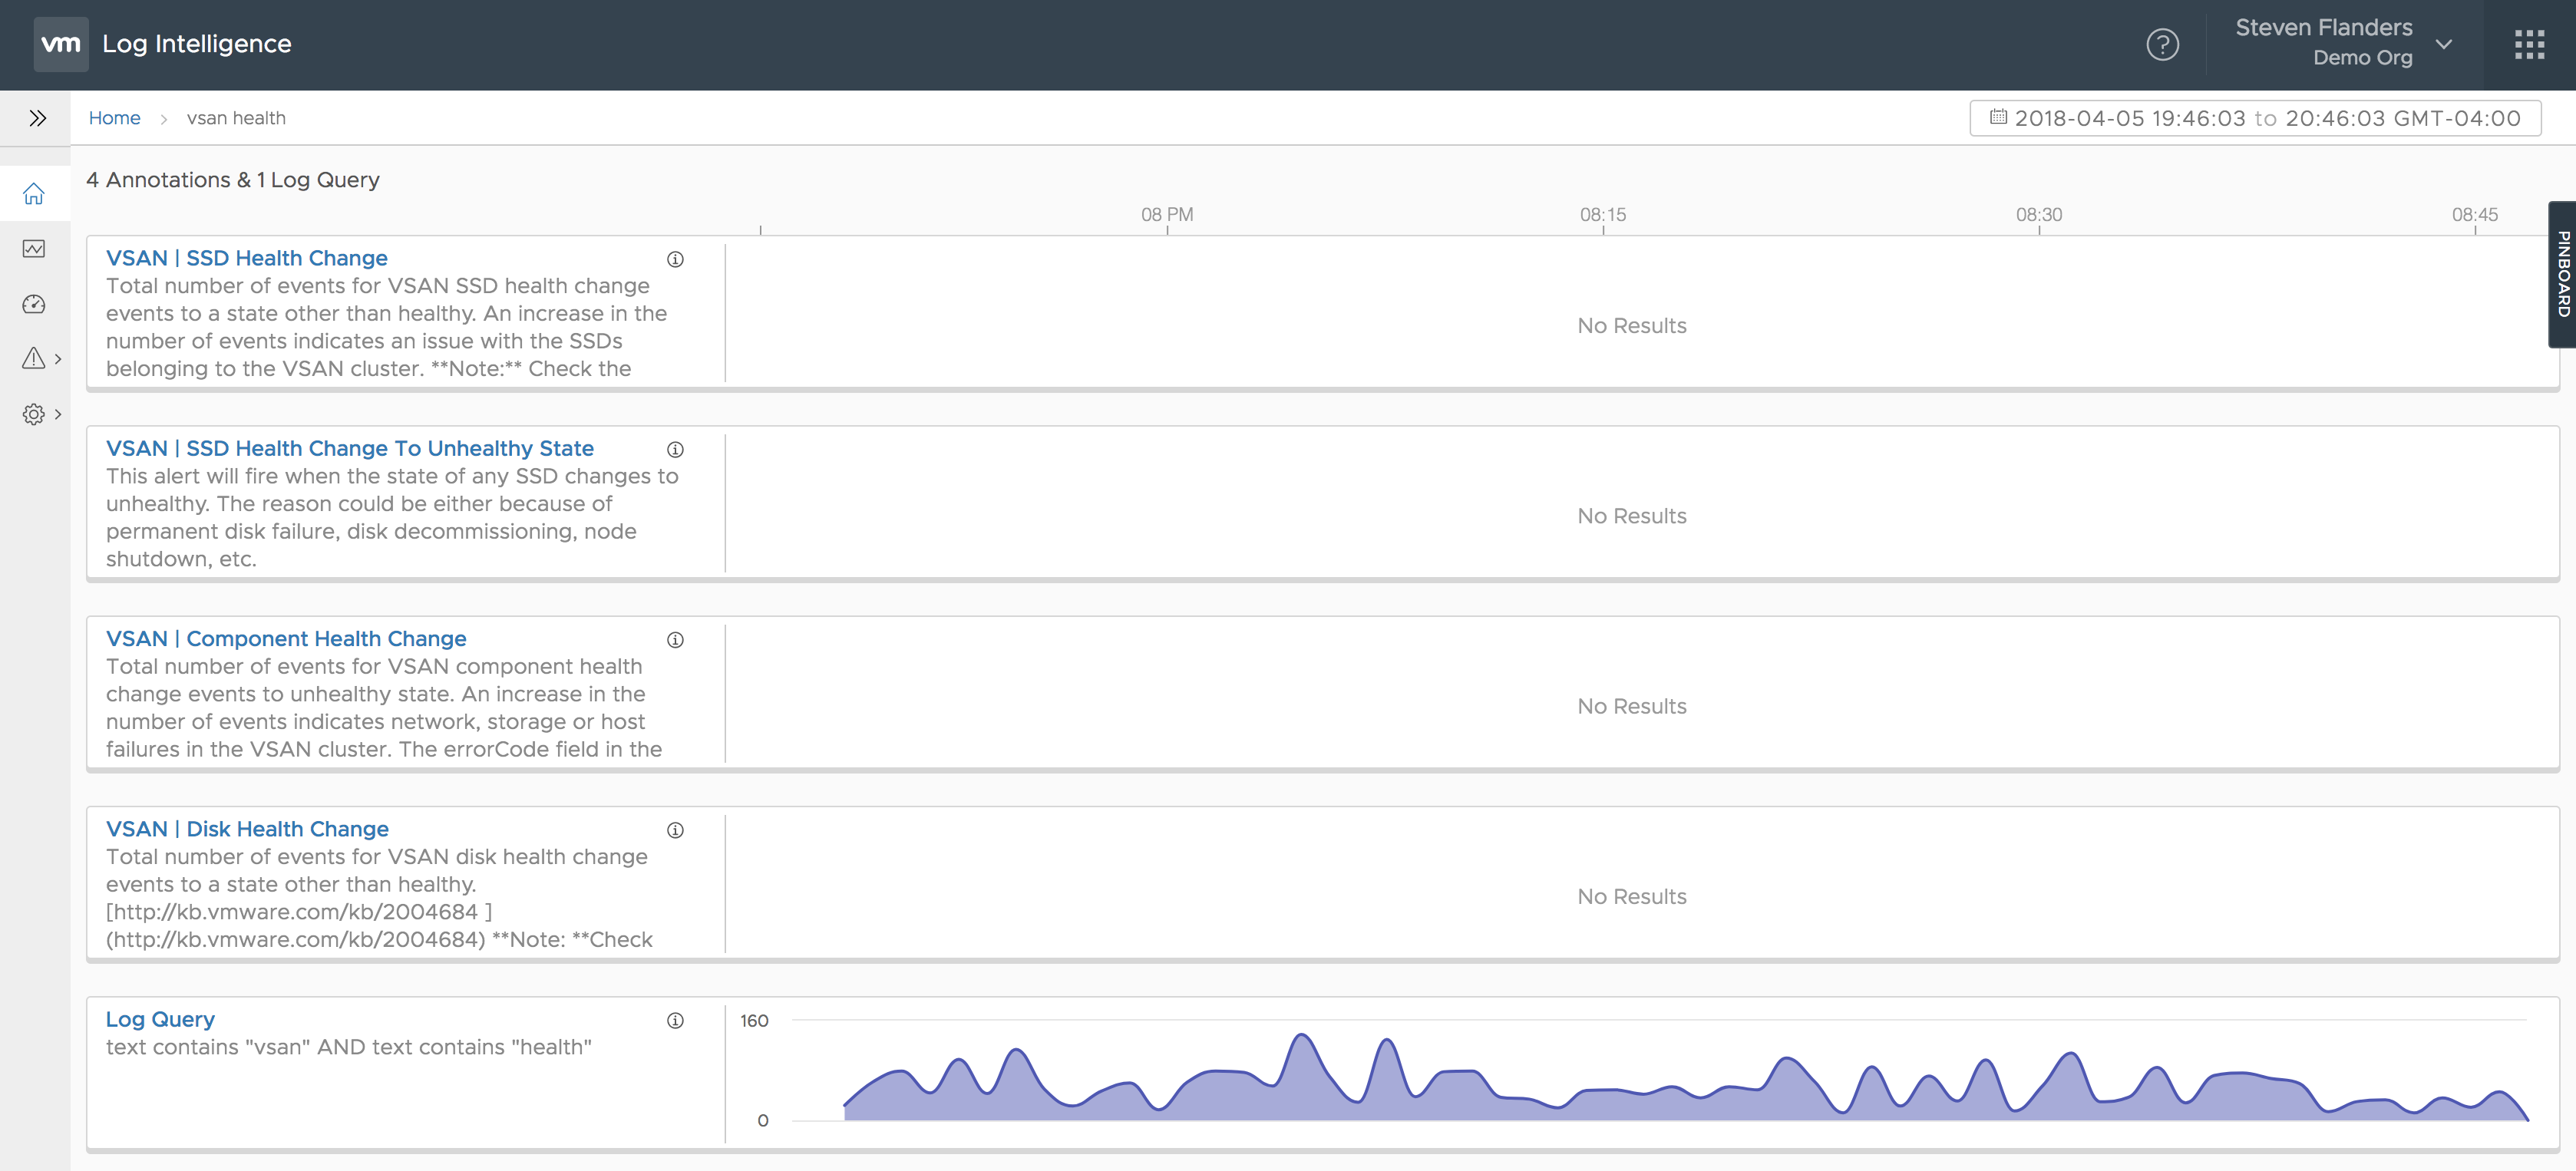
As you can see in this example, the content queries did not return any results, but if it did then you would instantly have more information than a traditional search over events only.
Query Assist
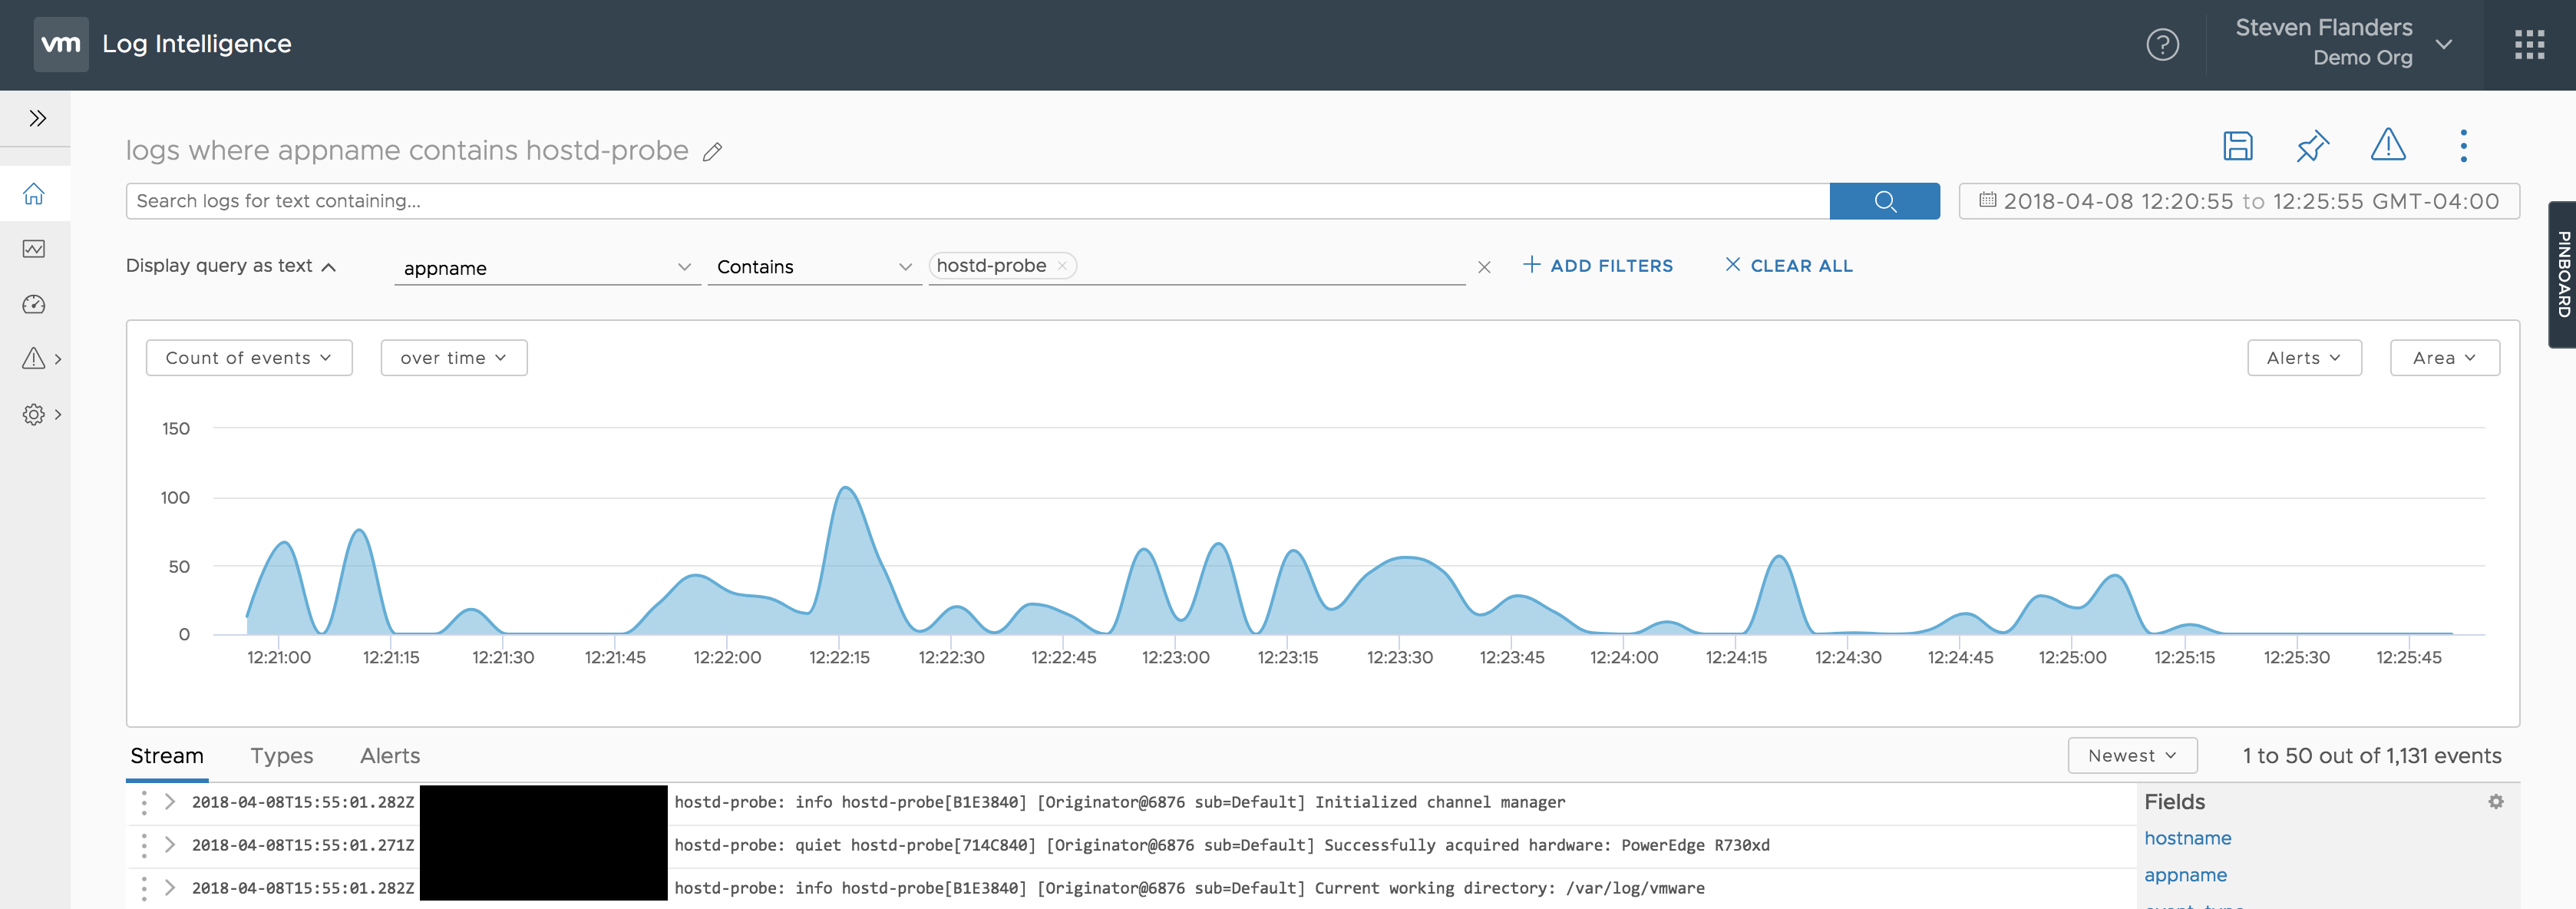
While Log Intelligence offers a natural search language interface (i.e. you do not need to learn a proprietary query language), it still requires some clicking through the UI to add filters and complex boolean logic. The search bar offers a way to make this even easier through auto/tab complete. You will notice the search bar by default shows “logs”, if you tab it will continue to populate the query for you. The “logs where” syntax is the query assist I am referring to. Notice how easy it is to construct a query:

Once you are happy with your query just hit the enter key and it gets automatically translated on the Explore page for you:
How cool is that!?!
Recent Alerts
The recent alerts card shows you alerts that are configured that have recently triggered. In addition to seeing the latest five alerts, you can see a timeline of when the alerts fired over the last hour with the option to change this timeline to the last day. For the latest five alerts you have the option of clicking the title to learn more about that particular alert. You can also select the More Alerts button at the bottom of the card to see more alerts that have triggered.
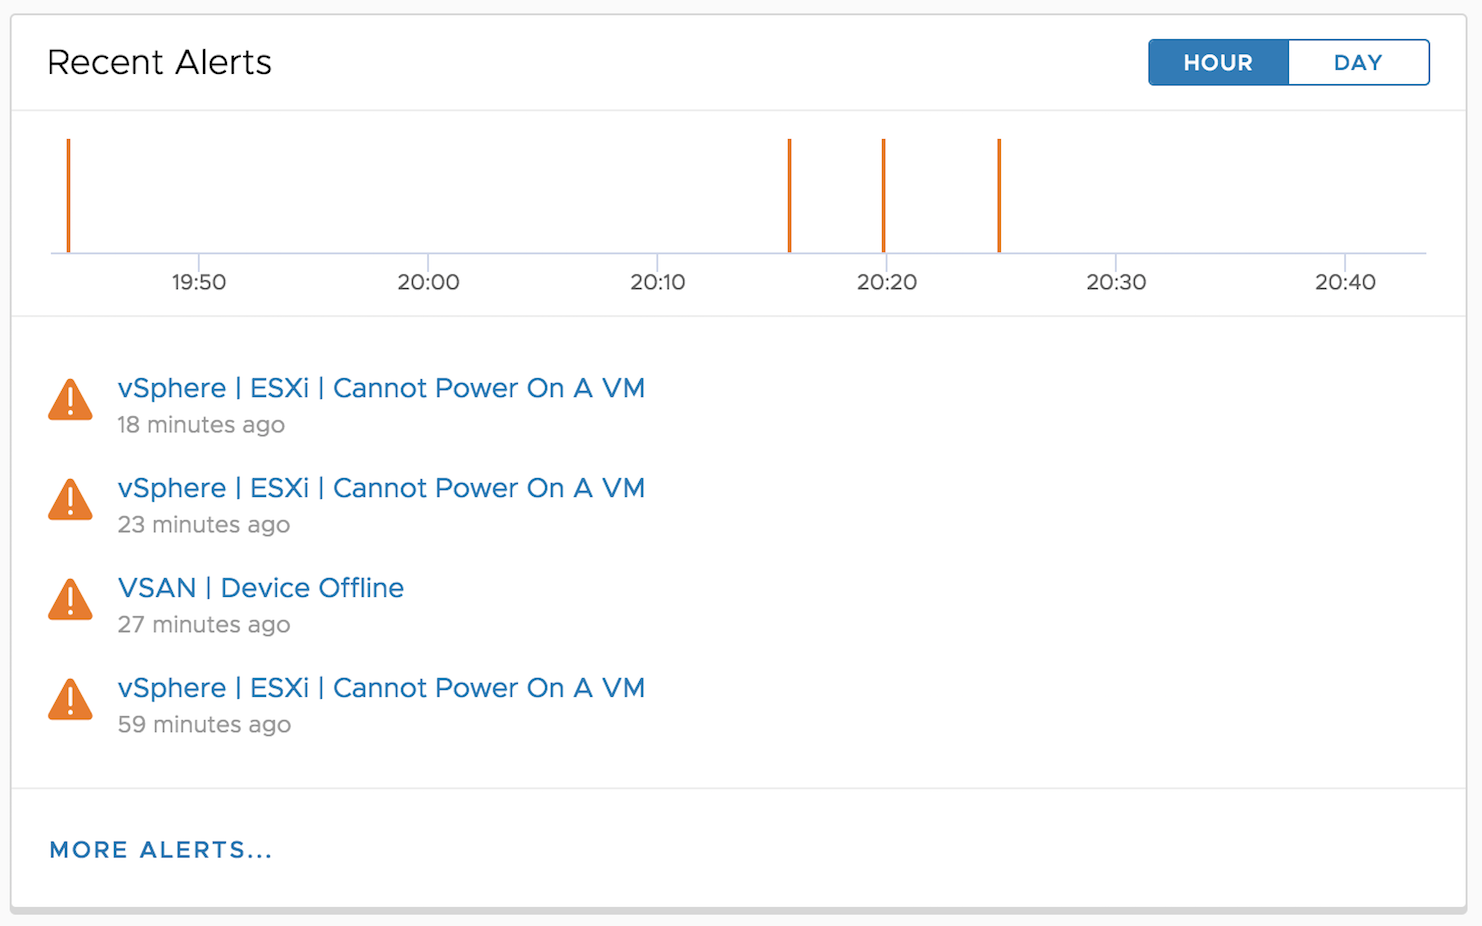
Understanding which alerts have recently fired in your environment can be significantly helpful when troubleshooting an issue. They can help point you in the right direction. Of course, in order to see recent alerts, you need two things:
- Alerts to be enabled
- Events to match the alerts enabled
As previously mentioned, Log Intelligence comes with built-in SDDC content, which includes alerts. You can of course create your own alerts as well. By default, no alerts are enabled in Log Intelligence. Log Intelligence encourages you to enable alerts if you have not already:
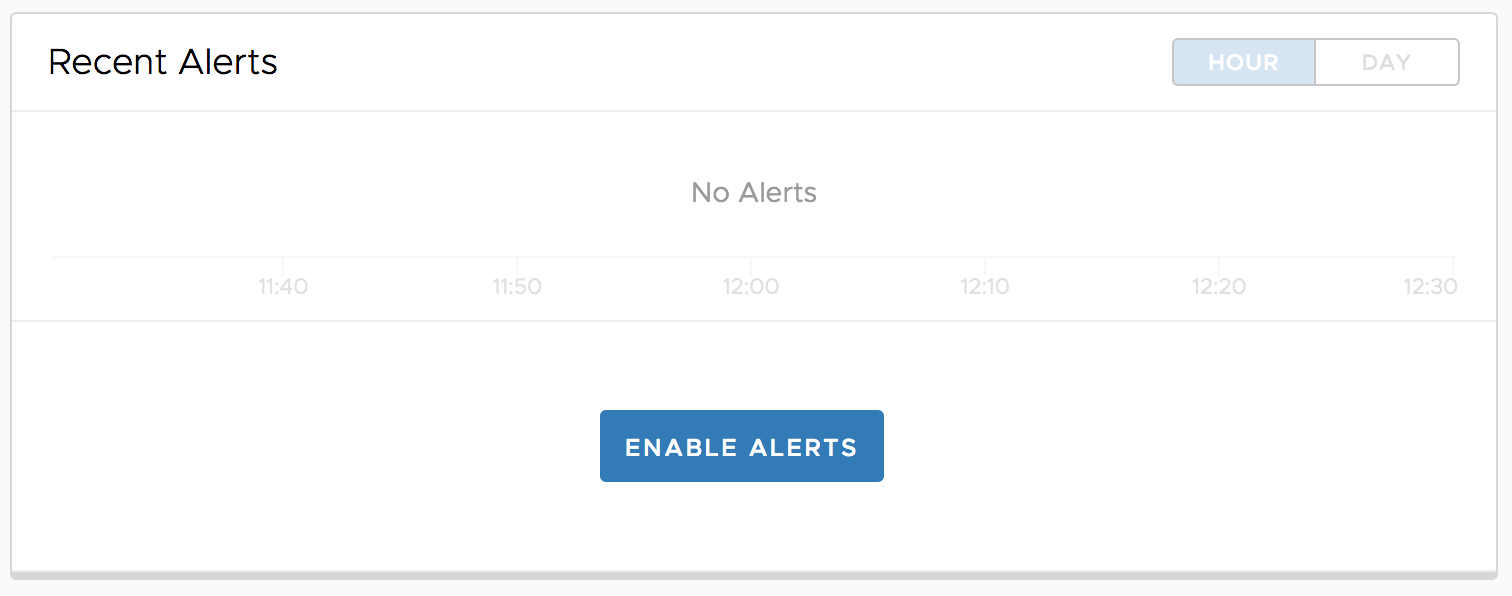
While this post is about the home page, the Recent Alerts page is just a bigger version of the Recent Alerts card on the home page so I figured I would cover it here. In addition to selecting the More Alerts button at the bottom of the Recent Alerts card, you can also navigate to the Alerts left-hand navigation and select Recent Alerts. As you can see, this page is a bigger version of the home page card, but also features more than the latest five alerts and has filtering capabilities:

Finally, each alert offers options including:
- Details
- Definition
- Query
Event Observations
Event observations are what they sound like — they are things that Log Intelligence has observed about the events you are ingesting. Observations are not alerts. They could indicate an issue or they may not. They serve as an additional data point as you analyze your events. Upon going to the home page, Log Intelligence runs the observations looking for matches. Any matches returned are automatically populated in the Event Observations card:
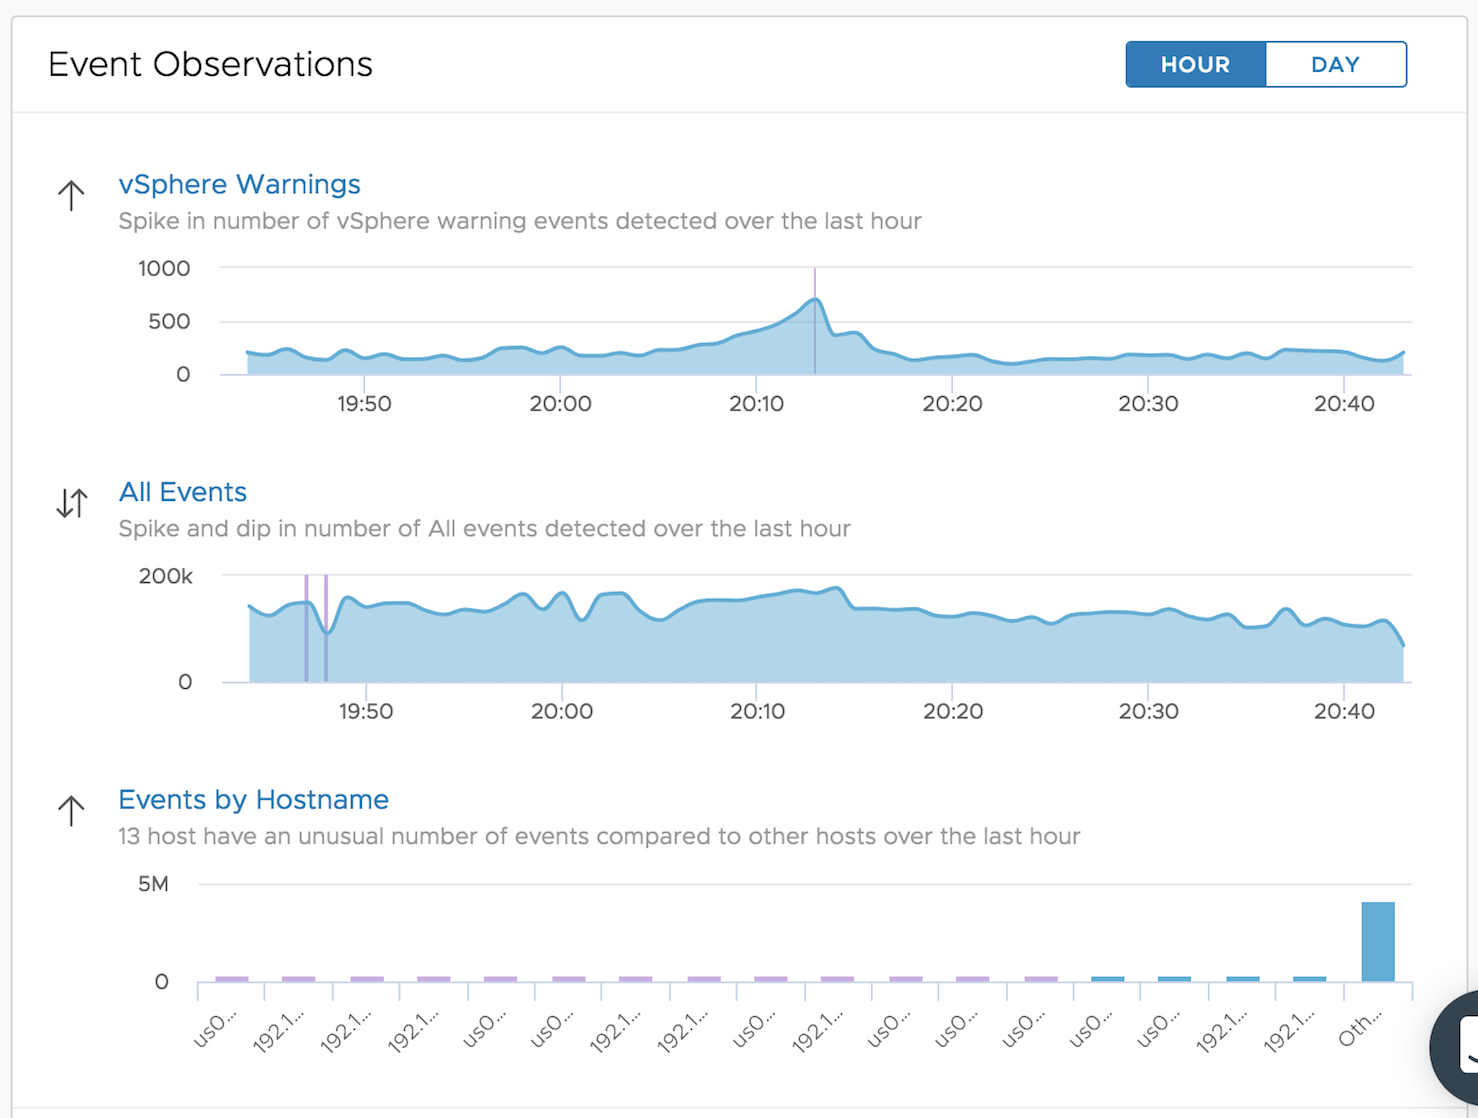
If no matches are found then the Event Observations card also reflects that. Today, Log Intelligence comes built-in with the following observations:
- All Events
- Events by Hostname
- vSphere Errors
- vSphere Warnings
For any given observation, one or more of the following operations may be applied:
- Inflection (spike/dip)
- Outlier (different from rest)
- Sum
You can see all the observations and their configured operations by selecting the More Observations button on the bottom of the card:
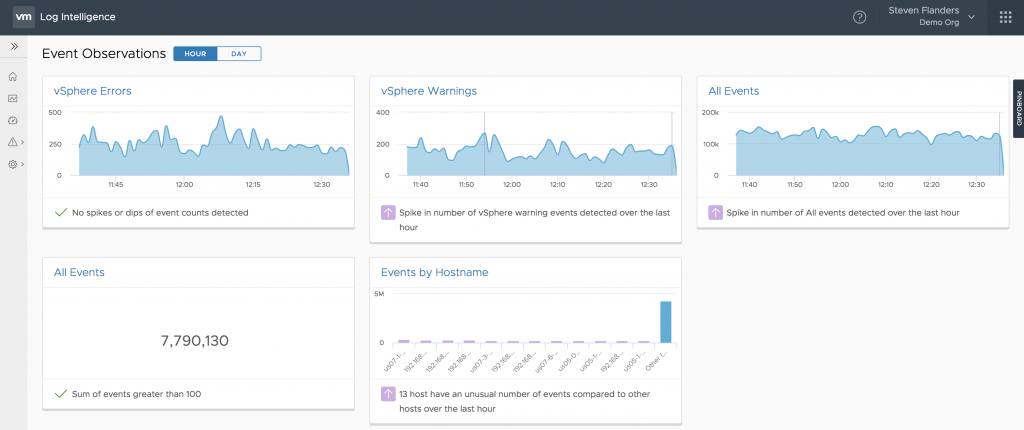
Today, you cannot add or edit Event Observations, but stay tuned for future announcements!
Chat Support
I would be remiss not to discuss the icon in the bottom right-hand corner:

While it is not specific to the home page or even Log Intelligence, it is one of the first places you will notice it so let me cover it now. As this section indicates, this button is for chat support. Upon opening it, you have the option to start of edit a conversation, which gets you in contact with VMware Technical Support. You can use this feature to ask a question or get support.
Summary
As you can see, the Log Intelligence home page makes it easy to get relevant information about your logs. It is not likely where you will spend most of your time in the product, but it is a great starting place. What do you think of the home page?
© 2018 – 2021, Steve Flanders. All rights reserved.

