
If you are looking for a solution to handling metrics in the Cloud Native era, you have likely come across Prometheus. In this post, I would like to dig into Prometheus. Read on to learn more!

What is Prometheus?
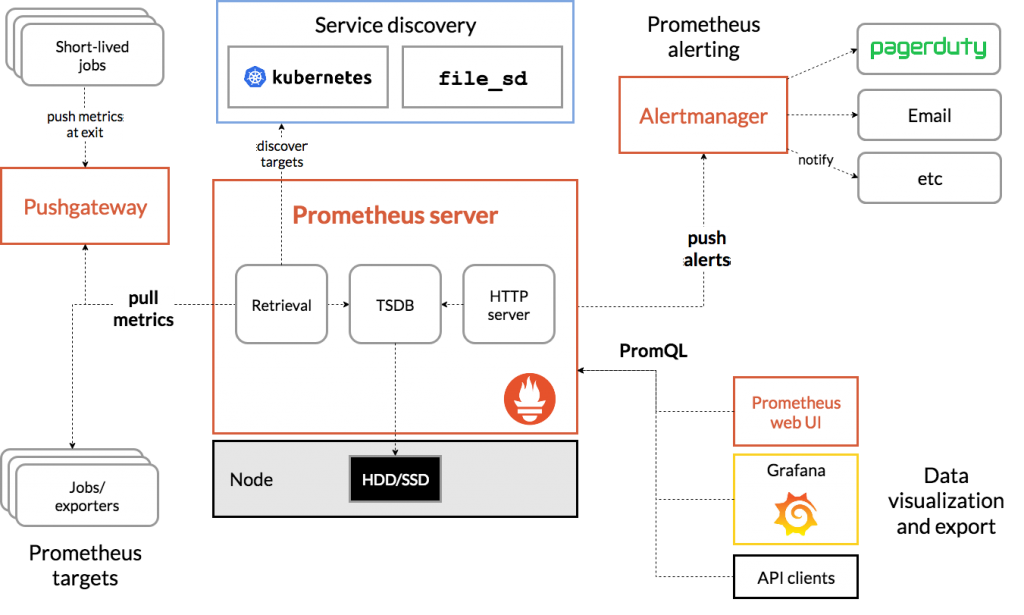
Prometheus is an open-source metric collection, query, and alerting platform. Their overview section does a great job explaining the product: Prometheus scrapes metrics from instrumented jobs, either directly or via an intermediary push gateway for short-lived jobs. It stores all scraped samples locally and runs rules over this data to aggregate and record new time series from existing data or generate alerts. Grafana or other API consumers can be used to visualize the collected data.
Prometheus’s main features are:
- a multi-dimensional data model with time series data identified by metric name and key/value pairs
- a flexible query language to leverage this dimensionality
- no reliance on distributed storage; single server nodes are autonomous
- time series collection happens via a pull model over HTTP
- pushing time series is supported via an intermediary gateway
- targets are discovered via service discovery or static configuration
- multiple modes of graphing and dashboarding support
The Prometheus ecosystem consists of multiple components, many of which are optional:
- the main Prometheus server which scrapes and stores time series data
- client libraries for instrumenting application code
- a push gateway for supporting short-lived jobs
- special-purpose exporters for services like HAProxy, StatsD, Graphite, etc.
- an alertmanager to handle alerts
- various support tools
Collection
Prometheus supports both push and pull-based metric collection. For better or worse, Prometheus has a proprietary ingestion format. As a result, it has special exporters to support format translation for things such as StatsD. For push-based collection, you need to push metrics to the push gateway in the appropriate format. For pull-based collection, if you are on something like Kubernetes, all you need to do is add annotations to the object you wish to scrape:
...
spec:
  template:
    metadata:
      annotations:
        prometheus.io/scrape: "true"
        prometheus.io/port: "9102"
        prometheus.io/path: "/metrics"
...
Queries
Prometheus offers a powerful but proprietary query interface. Querying is done based on metric name, can be wrapped by one or more function calls, supports filtering based on labels, handles different time ranges, and supports grouping. To get started, you need to know the metric name though autocompletion of available metric names is built-in. From there, you can supply built-in functions (without autocomplete). Again, if you want to filter by labels, you need to know what you are searching for. Let’s look at some examples:
sum(up) by (kubernetes_pod_name)
IMPORTANT: The parenthesis are required!
Let’s break down this example:
- “sum” is a function that adds the value of the specific metric name
- “up” is a metric name that tells you whether an endpoint is up or not
- “by” is a grouping mechanism applied to the function
- “kubernetes_pod_name” is a label that may exist if you are running on k8s and you have properly configured it to label metrics with the pod_name
In my opinion, the hardest thing about querying in Prometheus is knowing what the available metric names and labels are. To figure this out, you have a few options:
- Go to the endpoint and check the metrics page (e.g., http://podname.default.svc.cluster.local:9102/metrics)
- Run an inefficient query on Prometheus like
sum(__name__) by (__name__) - Query for a metric on a given endpoint and see what labels it contains
The rest is just syntax that you can easily reference:
Also worth noting, Prometheus is not meant to be a dashboarding tool. It supports the ability to query and offers basic graphing capabilities, but the queries and graphs constructed are not persisted. Prometheus recommends using Grafana (another open-source project) for dashboarding.
Alerting
One common use case for metric collection is alerting. Prometheus supports feature-rich alerting:
- Grouping: categorizes alerts of similar nature into a single notification. This is especially useful during larger outages when many systems fail at once, and hundreds to thousands of alerts may be firing simultaneously.
- Inhibitors: concept of suppressing notifications for certain alerts if certain other alerts are already firing.
- Silences: mute alerts for a given time.
Configuration is done via a CLI YAML file. You cannot create/delete/edit alerts in the Prometheus UI as of today. While YAML configuration is common in the Cloud Native world, it is not my favorite, given it is prone to errors and not intuitive. The configuration is proprietary and plentiful but consists of:
- Global options
- Routes: a node in a routing tree and its children
- Inhibit rules
- Receivers: where to send alerts (supports emails, Pagerduty, Slack, webhooks, etc.)
You can even create templates for the way notifications are sent. Here is an example of some alerts:
serverFiles:
  alerts:
    groups:
     - name: kubernetes-apps
        rules:
        - alert: KubePodCrashLooping
          annotations:
            message: '{{ $labels.namespace }}/{{ $labels.pod }} ({{ $labels.container
              }}) is restarting {{ printf "%.2f" $value }} / second'
          expr: |
            rate(kube_pod_container_status_restarts_total{component="kube-state-metrics"}[5m]) > 0
          for: 15m
          labels:
            severity: critical
        - alert: KubePodNotReady
          annotations:
            message: '{{ $labels.namespace }}/{{ $labels.pod }} is not ready.'
          expr: |
            sum by (namespace, pod) (kube_pod_status_phase{component="kube-state-metrics", phase!~"Running|Succeeded"}) > 0
          for: 15m
          labels:
            severity: critical
...
Also worth noting, another option is to construct alerts in Grafana. While this is easier (e.g., it can be done from the UI), it is a step removed from the data and does not offer as powerful capabilities. I would recommend leveraging Prometheus alerts over Grafana at this time.
Gotchas
After leveraging Prometheus for a while, I figured I would share some gotchas:
- Data corruption is possible on the Prometheus server — if this happens, Prometheus may not start until the corruption is manually deleted. In general, this means you need to delete the impacted subdirectory in
/data/wal. - Push gateway can become overwhelmed with too many labels — if this happens, it will stop working until the endpoint(s) are fixed. Simply reduce the number of labels being sent and restart the push gateway.
- Scraping only supports a single URI and either a single port or all ports per pod/container/VM — in Kubernetes, it is not uncommon for a pod to contain more than one container. As long as the port and URI for Prometheus scraping are the same for all containers in the pod, you are good; otherwise you can only specify one. As an example, the default path for scraping is
/metrics, however, something like Envoy (sidecar proxy) requires/stats/prometheus. - Querying is done via metric names — this means you need to know what you are searching for. As an example, let’s say you deploy Nginx and start scraping its metrics. How do you know what metrics it exposes? It turns out you cannot query for this (easily/efficiently) in Prometheus. The best bet is to check the metrics endpoint on Nginx to determine the metric names.
- Prometheus does not support HA — sure, you can run two separate, independent instances, persist the data twice, put twice the load on the system, configure sticky sessions and somehow figure out how to make all your Grafana dashboards work with both instances, but that is not HA. Alternatively, you could look into leader election to a shared backend. In short, good luck!
- Prometheus is more optimized for short-term data persistence — something like Graphite supports long-term data persistence better. It is not uncommon to send Prometheus metrics to another metric backend.
- Prometheus does not support Federation — yes, I know documentation exists, but as it states, a single Prometheus endpoint cannot be used to aggregate ALL data from other Prometheus servers. In addition, it cannot issue a query to a child Prometheus server. Having to log into multiple, separate instances to get data is not federation, and good luck supporting your Grafana dashboards.
Summary
Prometheus is a powerful metrics tool and one ubiquitous in the Cloud Native space (especially given it is only one of two projects that have graduated from CNCF). It offers pull and push-based collection with hooks for common formats (e.g., statsd). It has a powerful proprietary query language as well as rich alerting capabilities. It is optimized today for short-term retention in non-HA configurations though options do exist to change these behaviors (your mileage may vary). For those just starting out on their Cloud Native journey, Prometheus is a solid choice. For those with existing metric collection, you will need to compare the feature sets with the business requirements to decide how to proceed.
© 2018 – 2021, Steve Flanders. All rights reserved.