In the Cloud Native world, distributed tracing is critical to proper observability. A couple of open-source projects offer a way to collect and analyze trace data, namely Zipkin and Jaeger. In this post, I would like to dig into Jaeger. Read on to learn more!

What is Jaeger?
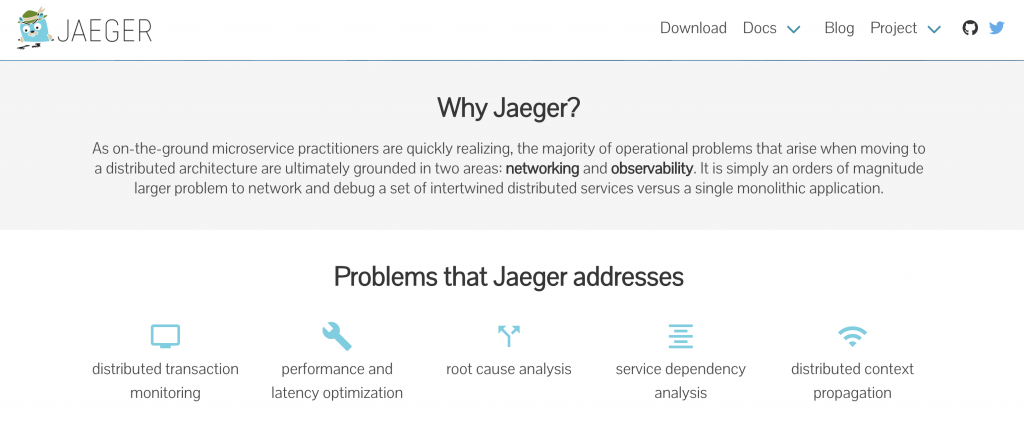
Jaeger is an open-source distributed tracing collection and analysis tool.
Architecture
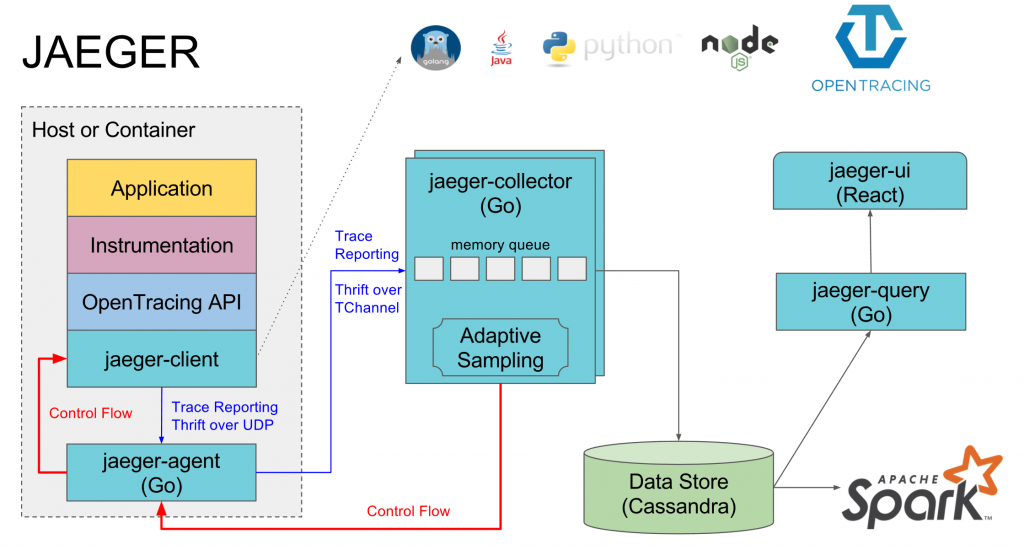
Jaeger is made up of a variety of components, namely:
- Client libraries
- Agent
- Collector
- Query
Collection
To get started with Jaeger, you need to deal with the collection of tracing data. You have a few options in this regard:
- OpenCensus or OpenTracing
- Jaeger or Zipkin client libraries
When it comes to Jaeger, it does not matter which option you choose, though there are several considerations to take into account when deciding on a tracing framework (I will cover this in a future post). For greenfield environments, I would recommend looking at OpenCensus first and opting for either Jaeger or Zipkin client libraries if OpenCensus does not meet your current needs (again, more on this later).
Once tracing is in place, you need to decide how traces will be ingested into Jaeger. You can either send directly to a collector or go through an agent. When getting started, going directly to a collector is easier. I would strongly recommend going from client libraries to an agent and from an agent to a collector for production deployments.
Query
Open source distributing tracing tools are primarily focused on individual traces today. As such, when you log into the Jaeger UI, you are presented with a query interface around traces:
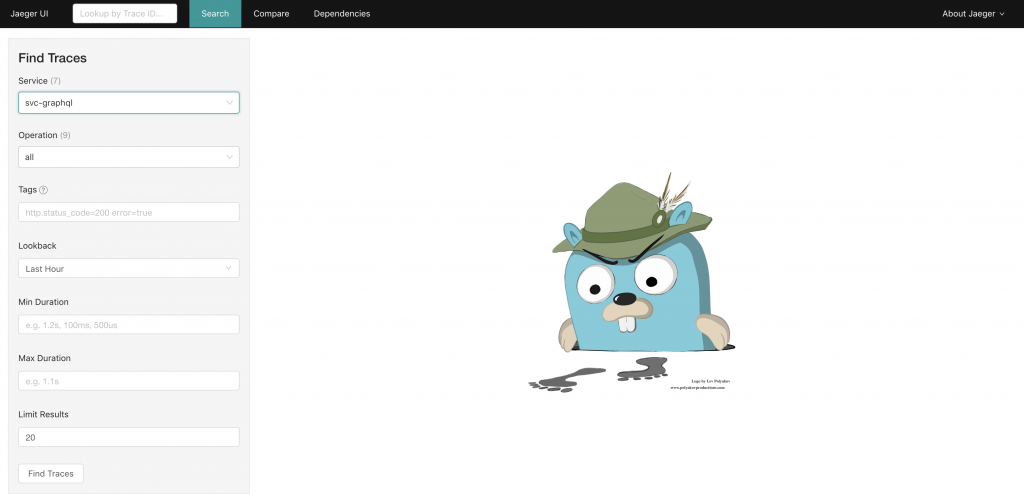
To get started, you need to tell the system what you are looking for. Your options include:
- Service (drop-down)
- Lookup by Trace ID (must know the ID)
When searching by service, you have the option to filter on a variety of parameters:
- Operation (span within a trace)
- Tags — you must know the exact key(s) and exact value(s) you care about
- Lookback — time range to query over
- Duration — you MUST specify the units
- Limit results — can only return a small number of results
Of these parameters, the one I would like to dig into the tags. As mentioned above, you need to know the exact key(s) and value(s) you care about. If you enter this wrong, you will get no results. If you do not know the key(s) or value(s), you should run a query without tags and look into what tags are available. The value(s) must be exact, globbing/wildcards are not supported. You can specify more than one set of key/value pairs by separating them by space. All specified key/value pairs are logically ANDed. It is not possible to perform other query operations (e.g., logical OR).
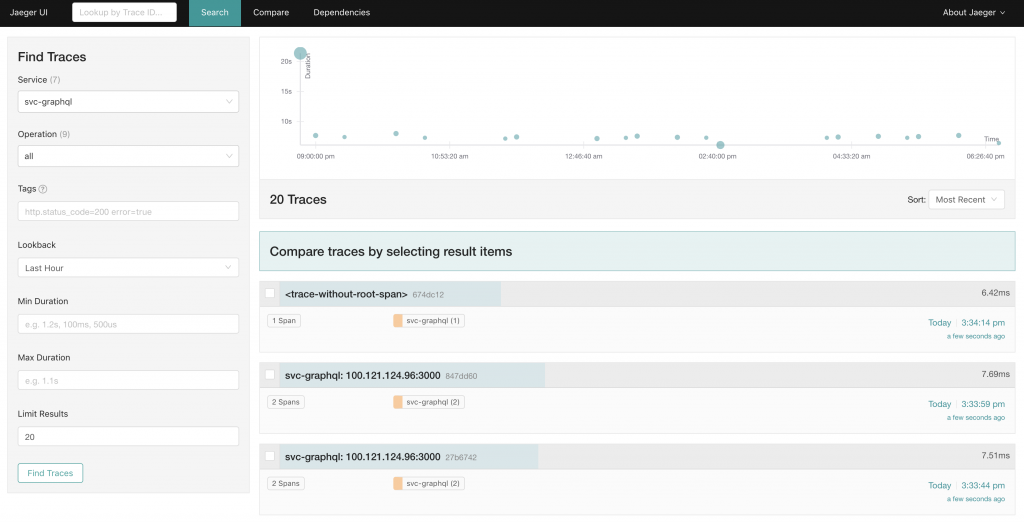
After running a query, you are presented with a visual representation of the results at the top and the individual results below the visual depiction. In my example above, you will see one that says <trace-without-root-span>. This can happen for a couple of reasons:
- Broken traces — not all services are properly instrumented
- Incomplete traces — not all spans for a given traces have been received yet (e.g., async spans). If this is the case, waiting a few seconds and refreshing will show the data.

If you select an individual trace, you will see all the data about that trace. This includes:
- All spans
- All durations
- Any metadata
To see the metadata, you can expand the individual spans:
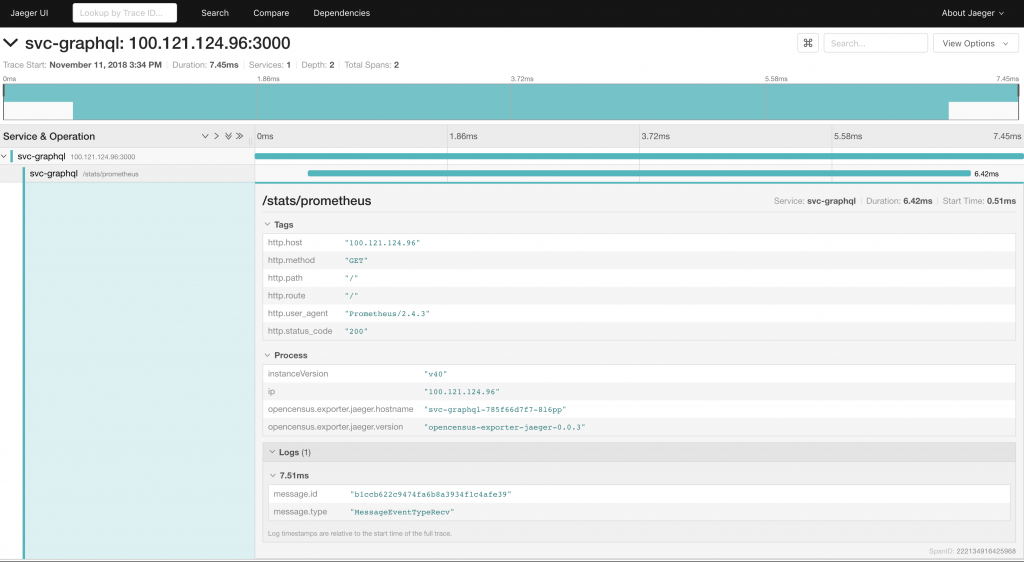
The metadata presented depends on the instrumentation used, and the configuration applied. The better the instrumentation, the better the data to analyze.
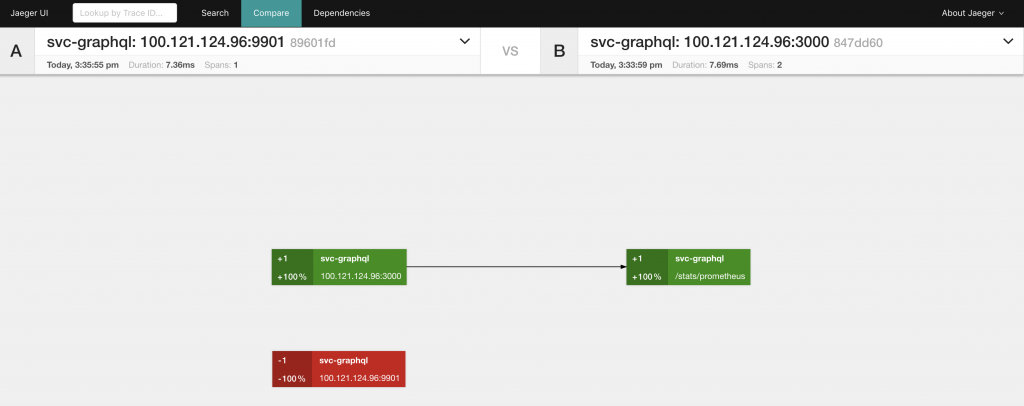
In addition to the search capabilities, you will see options to compare as well as show dependencies. Dependencies show you a basic service graph one level upstream and downstream from a specified service. Compare lets you compare to individually specified traces:
Gotchas
After using Jaeger for a while, I figured I would share some gotchas I have experienced:
- You have to know what you are looking for — because Jaeger is primarily focused on individual traces unless you have a specific issue or specific trace, you will probably not use the tool. Put another way, if you go to the UI for no reason and start searching, you will likely get little value out of the tool.
- Minimal query capabilities — you have to know exactly what you are looking for and be able to specify it in very specific and limited ways (an example is tags as specified above)
- Limited aggregation capabilities — the dependencies view is great, but seeing a complete service graph would be better (note this is not done due to performance and UI scalability reasons)
- Cassandra (default) backend results in inconsistent results — if you run the same query multiple times on the search page, you will get different results. This is because full table scans are expensive on Cassandra and, as such, avoided. The net result is that you cannot get consistent results when using a Cassandra backend.
- You are on your own for analytics — plenty of examples exist to integrate things like Apache Spark to get more value from the data, but none of this is built into the UI today
Summary
If you are looking to get started with distributed tracing, then Jaeger is a great option. In addition, if you have specific performance issues you are trying to track down, then Jaeger can provide immediate value. You need to ensure you are properly instrumented and collecting data, but there are plenty of easy ways to get started.
© 2019 – 2021, Steve Flanders. All rights reserved.
