
In my post about observability, I hinted to the importance of distributed tracing in the Cloud Native era. In this

What is Distributed Tracing?
Distributed tracing is the collection of data related to end-to-end requests within an application. A trace is made up of one or more spans where a span represents a call within the request. A call may be a microservice or a function within a microservice. The general structure of a trace looks like the following:
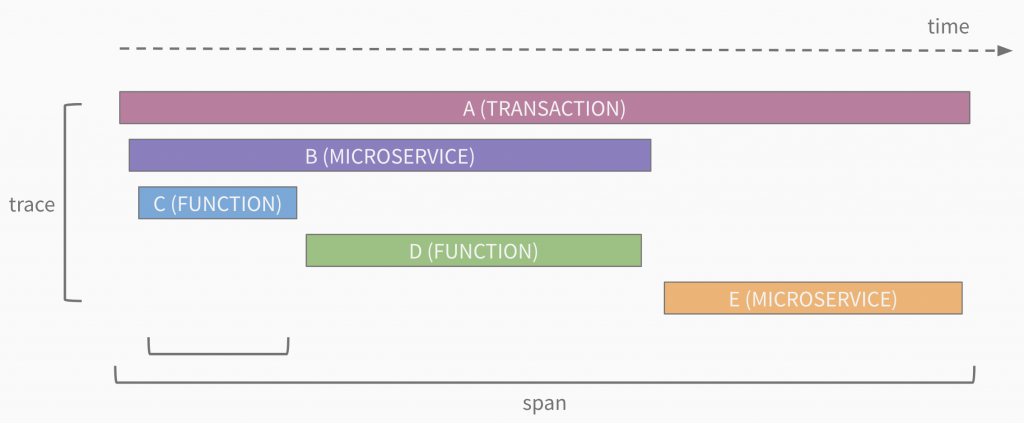
The first span in a trace is known as the root span. One or more child spans can follow it. Child spans can also be nested as deep as the call stack goes. A span includes a service name, operation name, duration, and optionally additional metadata.
How Distributing Tracing Works
Distributing tracing works through the instrumentation of libraries used in applications. The instrumentation handles creating unique trace/span IDs, keeping track of duration, adding metadata, and tracking context. The context part — known as context propagation — is actually the most critical. It is responsible for passing context between function/microservice calls. Context propagation is done based on the RPC you use. In the case of REST, this is header-based (i.e., your application must pass headers between service-to-service calls). To work properly, all services within a request must use the same context propagation format.
Why is context propagation so critical? Because it can be used outside of distributed tracing. For example, what if you could query all the logs generated for a given request through your application? With context propagation enabled, you could add a trace ID to your logs messages making this possible (more on this in a future post)!
Enabling Distributed Tracing
So, how do you enable distributed tracing? You basically have two options:
- Traffic inspection / Service mesh with context propagation — here the proxy is already instrumented to send trace data
- Code instrumentation with context propagation — here either a library used by the application is already instrumented or a developer can add custom instrumentation
Given most people do not leverage traffic inspection / service mesh today I will focus on the code instrumentation. The steps to get started are:
- Add a client library dependency
- Choose a context propagation format
- Instantiate a tracer
- Configure a destination
- Focus on instrumenting all service-to-service communication
- Enhance spans
- Add key/value labels
- Add logs
- Add additional instrumentation
- Integrations (e.g. DB calls)
- Function-level instrumentation
- Async calls
Open Source Options
When looking at adding distributed tracing you should be looking into open standard and open source data collection. The major players in this space are:
- Zipkin
- Released in 2012 and originally backed by Twitter
- Uses B3 header propagation — most commonly used today
- Natively supports OpenTracing
- Offers and end-to-end solution for analyzing individual traces
- Jaeger
- Released in 2016, backed by Uber, and a CNCF project
- Natively supports OpenTracing and Zipkin
- Offers and end-to-end solution for analyzing individual traces
- OpenTracing
- Released in 2016 and a CNCF project
- Provides an API specification as well as client libraries (only)
- OpenCensus
- Released in 2018 and backed by Google and Microsoft
- Support trace and metrics
- Natively supports Jaeger and Zipkin as well as Prometheus and Statsd
- Provides an implementation (API, client libraries, agent, and collector)
- W3C Trace Context
- Draft released in 2018
- Provides a trace context format definition
So, which should you choose? Like most things the answer is it depends. Here are some things to consider:
- Context propagation: If you already have existing instrumentation then you are bound to the context propagation format you are using unless you plan to migrate everything. In general, OpenCensus supports all formats so it can be introduced when/if desired.
- Library support: What do you want to instrument? Different libraries provide varying degrees of support for integrations so check the documentation.
Recommendation:
- Keep your existing context propagation format or if starting new use B3. Prepare to switch to W3C Trace Context once it is released.
- Choose the library that provides the support you need.
- Send trace data to the OpenCensus Service (regardless of whether you are using OpenCensus client libraries)
Summary
The move to distributed architectures has disrupted the traditional monitoring and troubleshooting landscape. Due to transient issues and cascading failures, it is critical to understand how requests are processed end-to-end (i.e., in context). Distributed tracing can address this issue but requires header propagation, instrumentation, data collection, and analysis. In the Cloud Native world, open source and open standards commoditize the instrumentation/propagation and collection of trace information. These technologies are reducing the friction of enabling tracing and laying the foundation for more powerful observability.
© 2019 – 2021, Steve Flanders. All rights reserved.