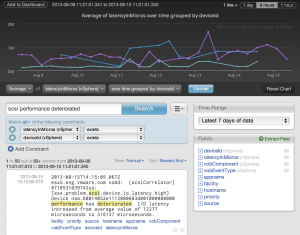
In case you missed it, William Lam recently put up a couple of excellent posts on how to configure some important vCenter Server alarms. As it turns out, the underlying VOB (VMkernel Observation) messages appear in vSphere logs and if you are running Log Insight you can easily check for environmental issues such as the ones he outlined.

The problem with vCenter Server alarms
While vCenter Server alarms are very powerful, I find that not every environment leverages them for monitoring. For those who choose not to leverage vCenter Server alarms, it is typically for three reasons:
- Too many alarms get triggered – by default, vCenter Server comes with some alarms preconfigured with thresholds and enabled by default. A classic example would be datastore capacity thresholds. In some environments, it is normal for datastores to be 90% full and this is not a concerning issue (e.g. a service provider where the customer pays for capacity). The underlying issue here is that default vCenter Server alarms are likely not sufficient for most environments (e.g. default thresholds need to be modified or necessary alarms are not defined and enabled by default).
- Editing alarms is difficult – while vCenter Server comes with some alarms built-in, several alarms that would be critical to monitor or not defined or not enabled by default. In order to create alarms, you need to know VOB events to add, something that is not very well officially documented. In order to manage alarms across vCenter Server instances, you need to automate alarm changes through tools such as PowerCLI.
- Fewer generic monitoring tools are better than more specific monitoring tools – vCenter Server alarms can monitor vSphere devices, but what about the infrastructure on which vSphere runs (e.g. storage arrays and network devices)? Instead of investing time and resources configuring a monitoring system specific to vSphere, why not configure a monitoring tool that is generic across more of the environment?

vCenter Server alarms can be very powerful, but if you are not leveraging them then how can you detect and alert on issues such as an All Paths Down (APD) situation?
Using Log Insight for vSphere monitoring
As you know, Log Insight can collect and analyze log messages from vSphere devices (as well as infrastructure devices). What you may not know is that VOB events are available in logs messages whether or not vCenter Server alarms are configured. This means you can monitor and alert on issues in your vSphere environment through log messages.

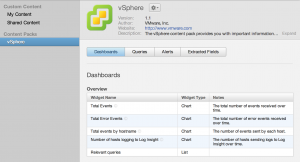
Now, the issue of what to look for and alert on still exists if you are manually looking at vSphere logs, but Log Insight ships with the vSphere content pack and it has queries and alerts built-in. In addition, new queries and alarms can be created as needed to handle environment-specific issues.

Important vSphere log queries to know
When you find a VOB event you may be wondering what it means, if it is important, and if it is important how to fix it. Below are some of the most common VOBs with links on where to find out more information about them. The vSphere content pack in Log Insight provides this information through notes attached to saved queries.
Critical
- net.vmknic.ip.duplicate
- storage.apd.start
- storage.apd.timeout
- visorfs.ramdisk.full
- vmfs.nfs.server.disconnect
Important
Depends
For information about some other VOBs, see: Alarms that can be configured in vCenter Server 4.x and triggered on ESX 4.x hosts. As mentioned earlier, many of these VOB events are already included in the vSphere content pack of Log Insight and I suspect more will be added with every new version of the content pack.
© 2014 – 2021, Steve Flanders. All rights reserved.
