
I have received some questions about what the different tabs below the search bar on the Interactive Analytics page do and when each should be used. These tabs are very powerful for troubleshooting and root cause analysis so I would like to discuss them in-depth.

Events
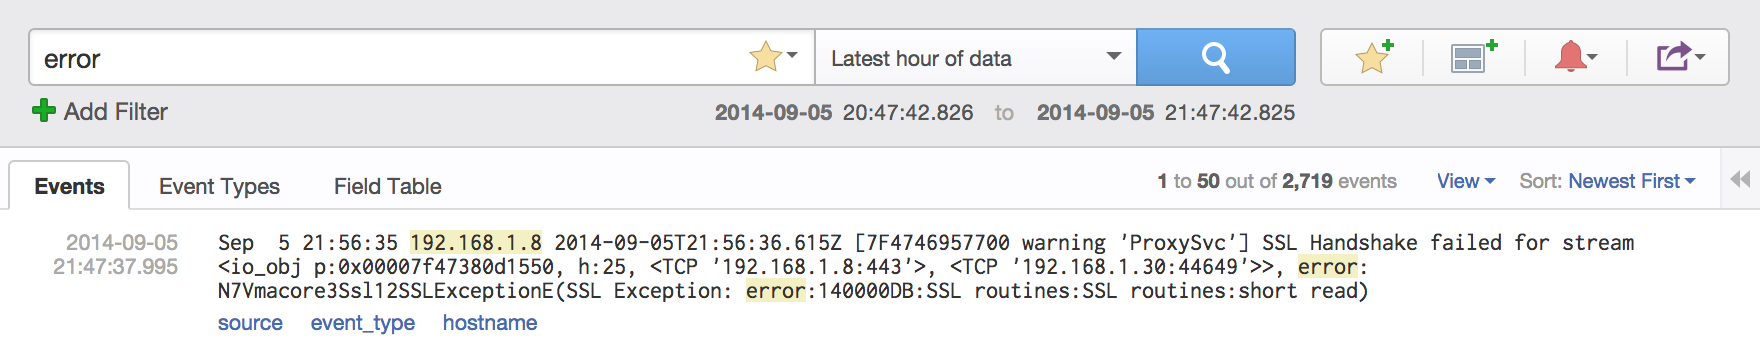
By default, the Interactive Analytics page displays the Events tab, which shows the actual messages (syslog and API) as well as the timestamp the message was ingested by Log Insight at and any fields that were found:
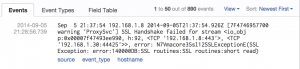
The Events tab is selected by default because after all, you are analyzing your events. Sometimes the actual events are necessary to troubleshoot an issue and other times the events are necessary to extract new fields and construct new queries for better troubleshooting in the future.
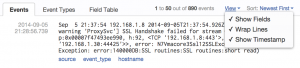
It should be noted that the Events tab view can be modified in a variety of ways including what is shown through the use of the View drop-down:
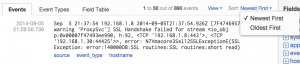
and the order in which the events are returned through the Sort drop-down:
Event Types
The Event Types tab provides a different type of abstraction and analysis through the use of machine learning:
![]()
On this tab, events are grouped together, or summarized, based on discovered patterns. Where the ingestion timestamp appears on the Events tab, a number is returned on the Event Types tab representing the number of times a specific event type pattern has been seen for the given time range of the query. This information is powerful to determine the noisiest events as well as the rarest events, both critical to troubleshooting.
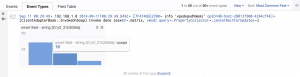
In addition, for each event type, a schema is discovered. This schema can be seen through the use of one or more hyperlinks within an event type. This schema discovery can detect things such as timestamps, hostnames, numbers, hex, and strings. The result is a new type of field, called smart fields, that can be used similar to extracted fields on the Events tab:
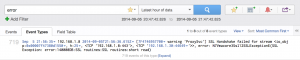
One example use case of how the Event Types tab is powerful and how it is can be used is as follows: construct a query that returns a large number of results (2,719 in this case):
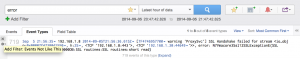
Attempting to manually look at every result and exclude unnecessary information is tedious, time-consuming, and error-prone. After constructing this query, switch to the Event Types tab:
Notice how the number of results has been reduced significantly, often less than 50 (8 in this case), a number that is easily scannable and actionable including the ability to exclude event types in one click:
Field Table
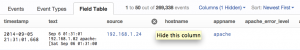
The Field Table tab presents the same information as the Events tab, but in a different format:
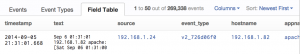
In this view, each field represents a column, making it easy to see how fields line up across events. This view can be helpful especially for more real-time analysis of events where the number of events returned is small. The Field Table view can also be modified as desired including showing/hiding columns (fields):
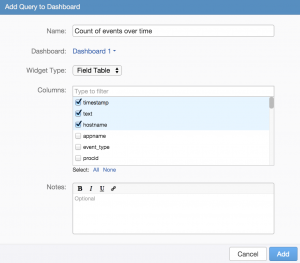
A Field Table can be saved to a Dashboard by selecting the Dashboard link to the right of the Search button and selecting the Field Table widget type:
Summary
As you can see, the three different tabs on the Interactive Analytics page present ingested data in different formats making it easier to perform troubleshooting and root cause analysis. The Events tab contains the actual events ingested as well as fields that can be used to manipulate the results returned and the format they are returned in. The Event Types tab provides summarization as well as schema discovery for ingested events making analysis of events quicker and easier. The Field Table tab provides information about events based on fields and can be very valuable for queries that return a small number of results.
© 2014 – 2021, Steve Flanders. All rights reserved.