
I often get asked for specific examples on how Log Insight is / can be used to root cause an issue. I recently had an issue in my homelab that impacted my vCenter. In this post, I will cover the value Log Insight provided and how I was able to reach a root cause. Read on to learn more!
![]()
Issue
One day, I attempted to open the vCenter web UI only to be greeted with an error:
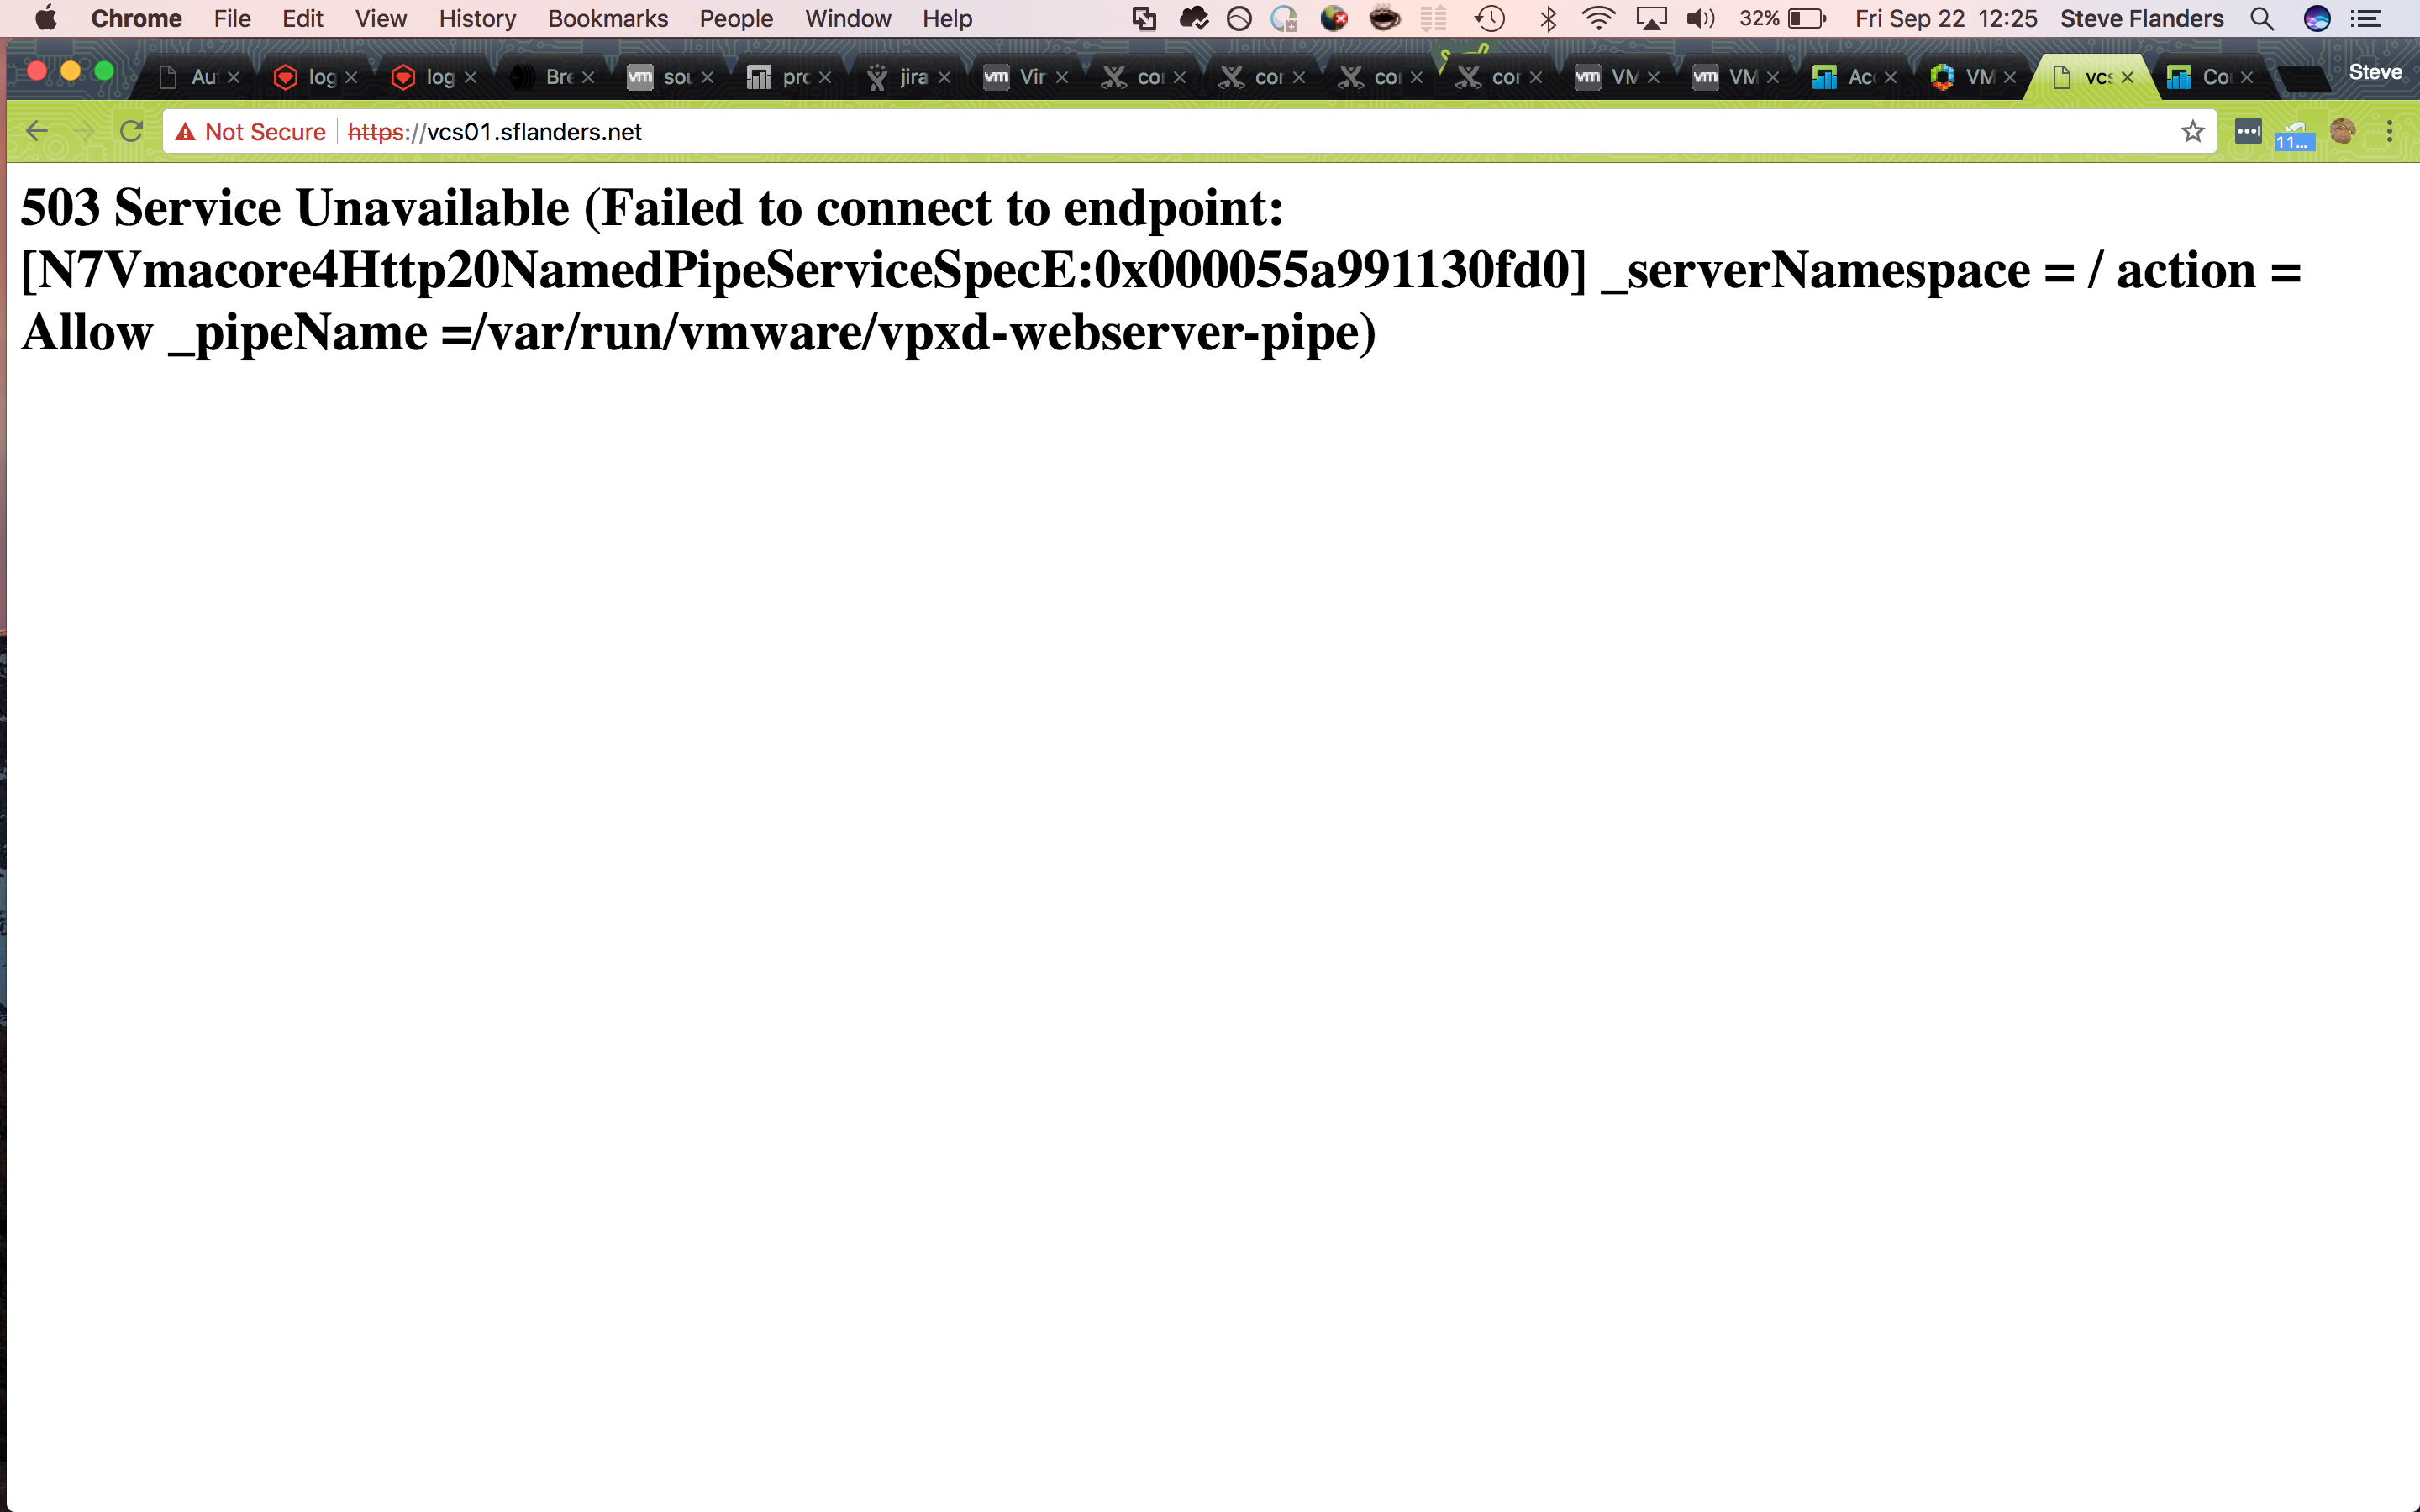
In order to determine what was going on, I decided to SSH to the appliance on to find that the password was not allowing me in (and yes I was entering the password correctly)). Given the symptoms, I had an idea what we going on, but I wanted to prove my suspicions so I turned to Log Insight.
Creating a timeline
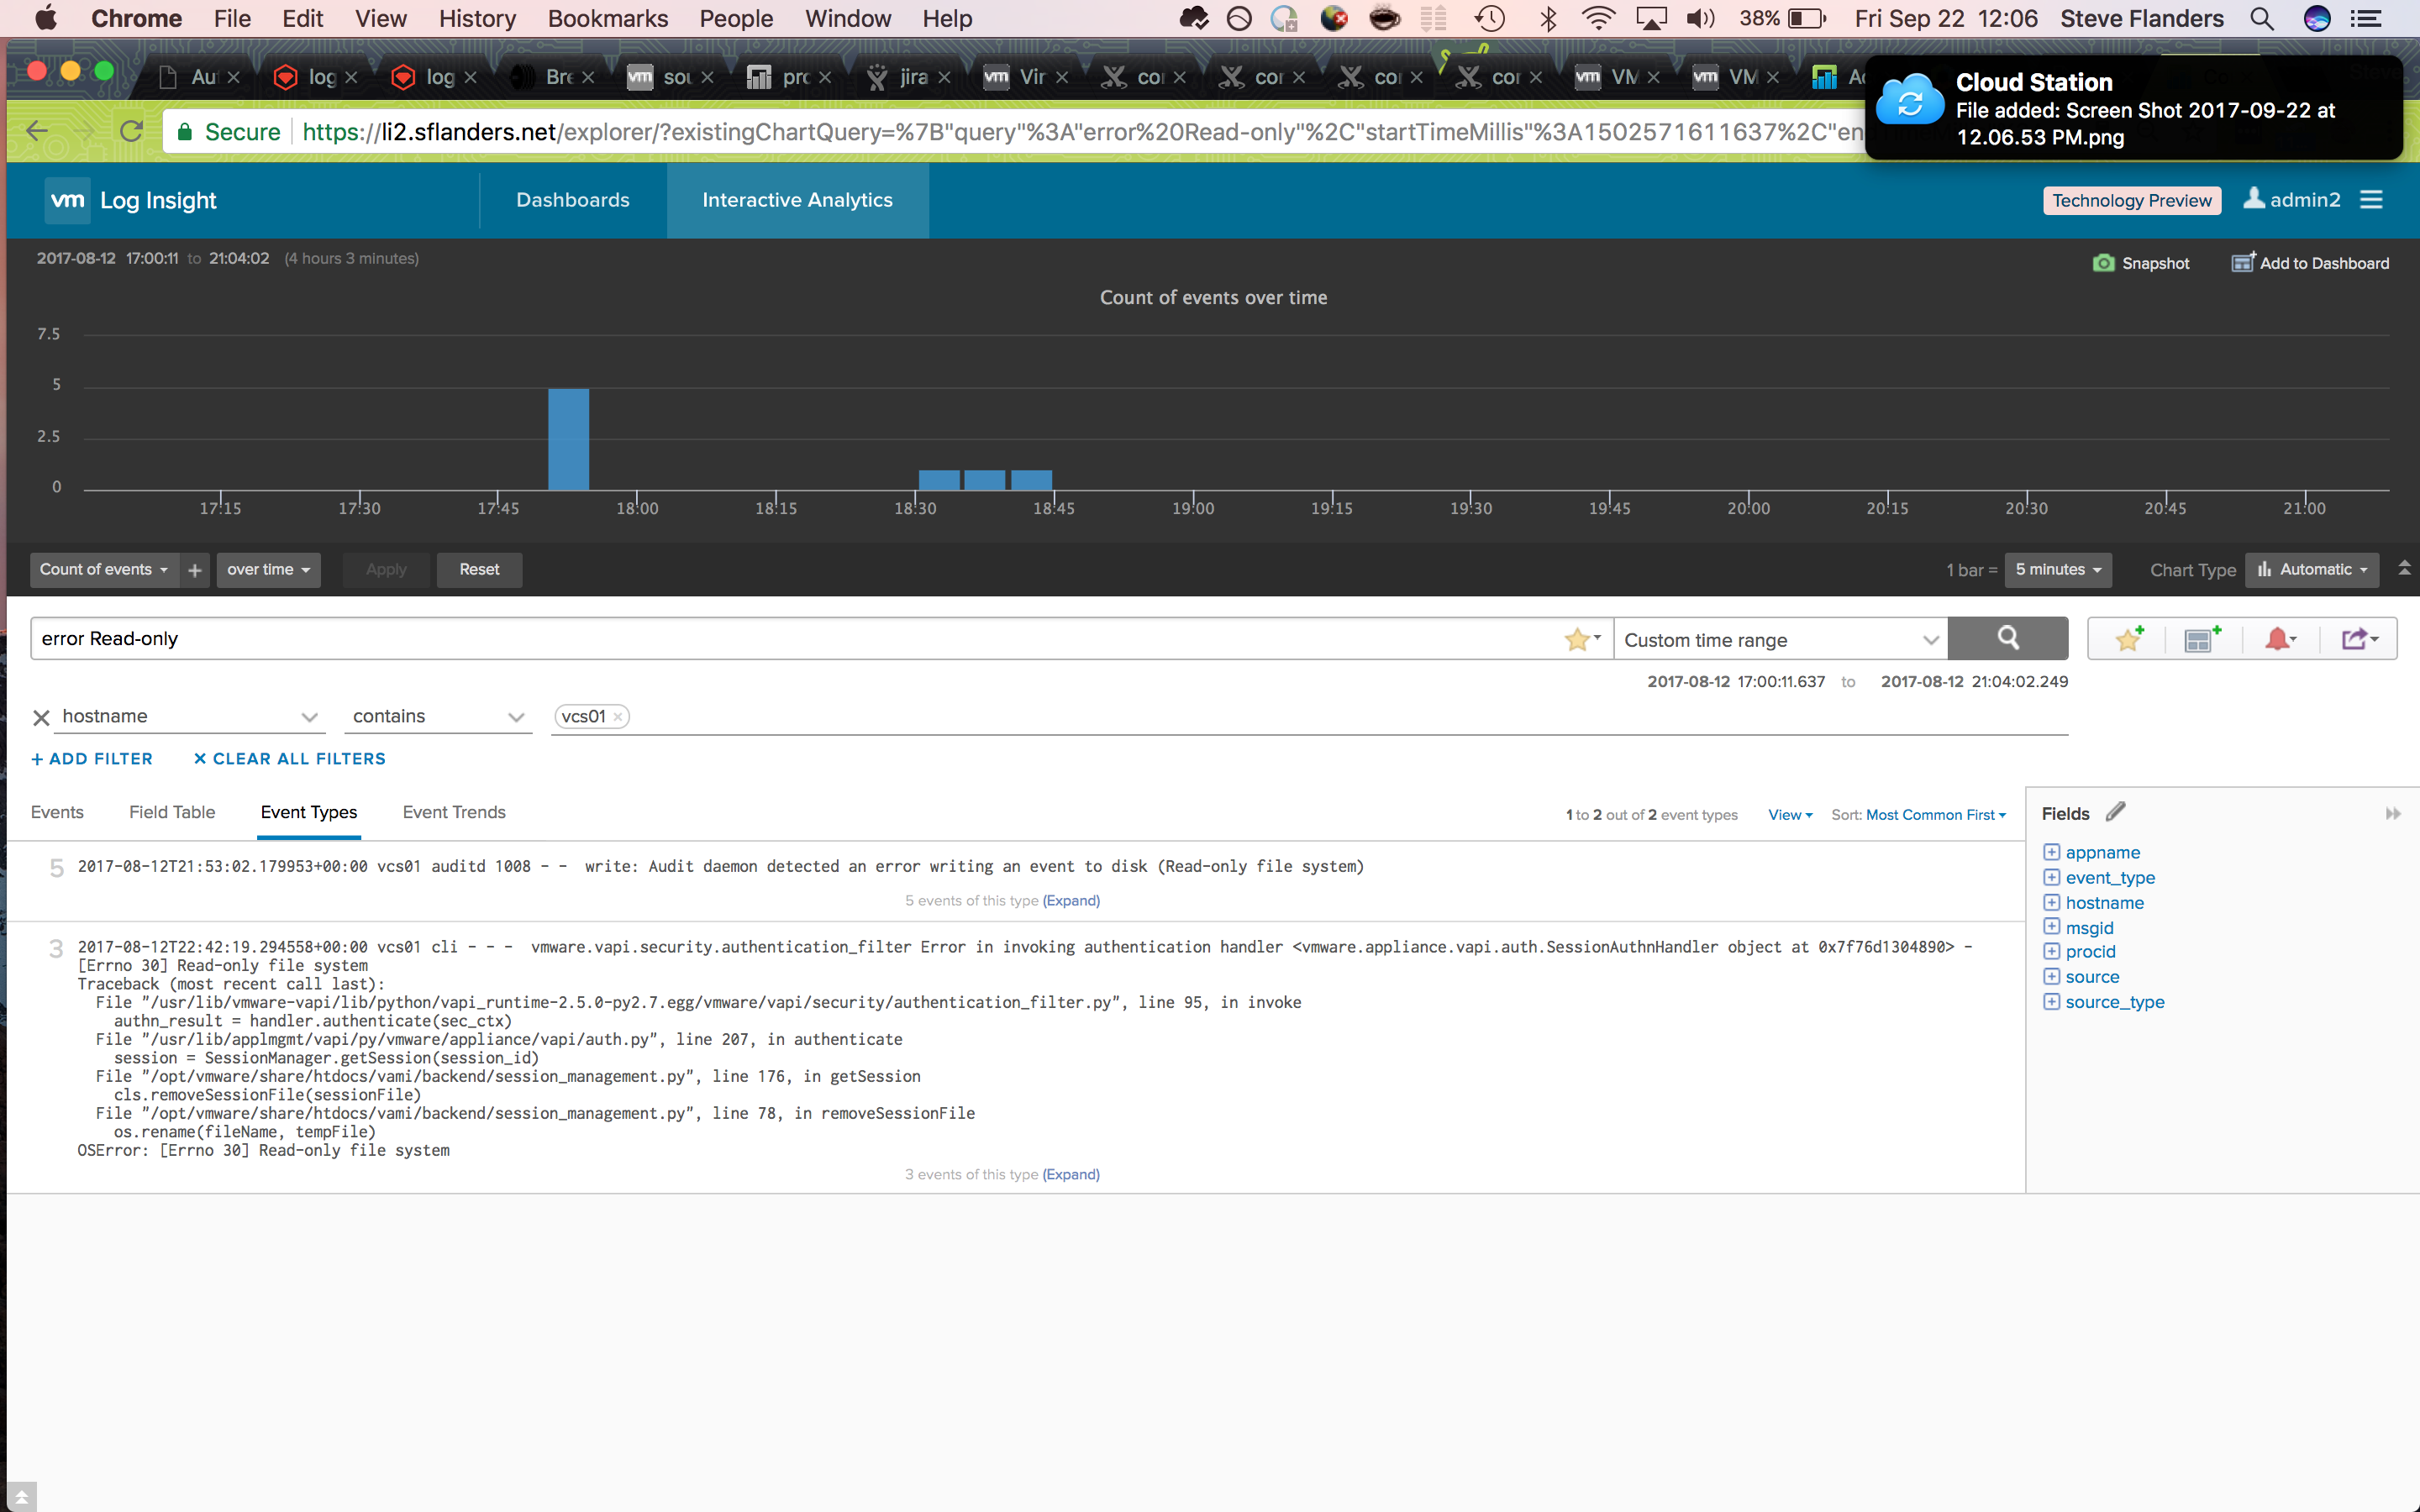
When using Log Insight, my goal is to pinpoint the issues and establish a timeline of events. In general, I try to focus on known errors, determine when they started occurring and look for interesting events around the first time of the error in question. In this case, I knew the hostname in question and the last (not first) time an error was seen. Given this, I asked Log Insight to show me all events from the vCenter hostname that contain the keyword “error”. In order to make the data easier to consume — because it is common for such a query even over a small time range to return a large number of results — I switched to the Event Types tab:
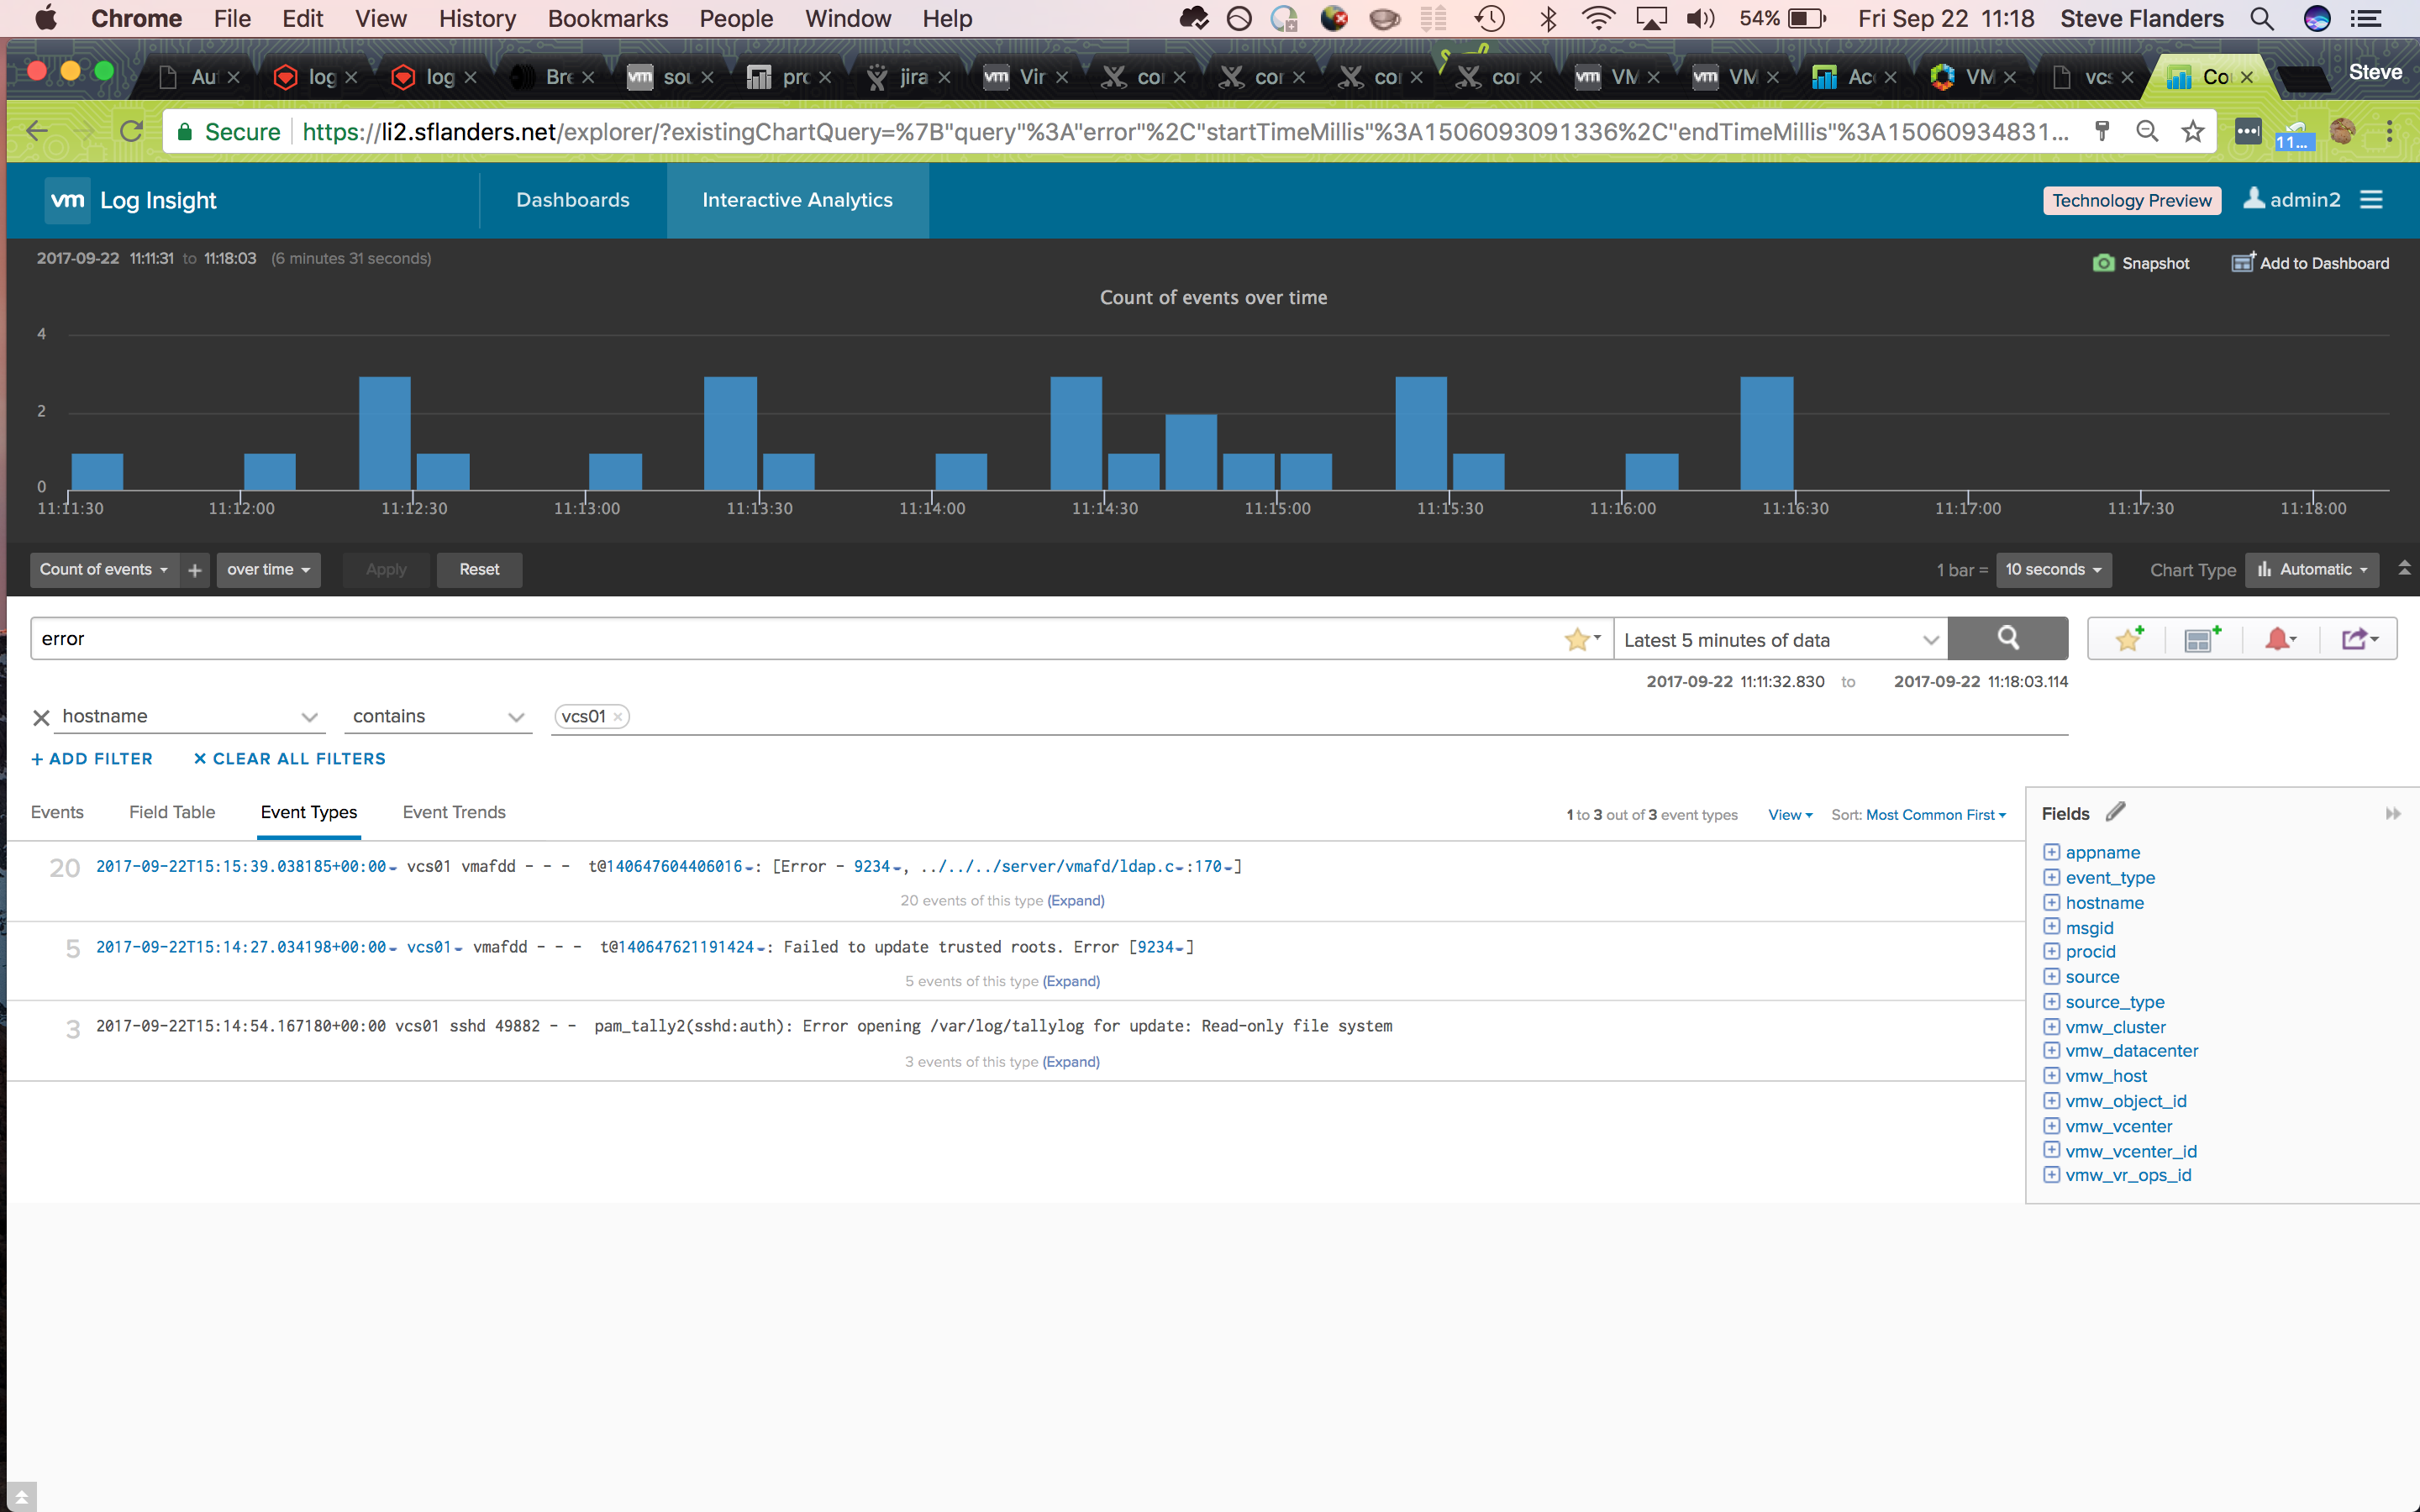
As it turns out, the last event type turned up an interesting result and confirmed my suspicion — vCenter had gone read-only. Now that I knew of a particular problem with vCenter, next I wanted to determine the first time I had seen this particular event. A search on Log Insight returned no additional results — this is not surprising given the event would only be logged when I accessed the UI and I had not logged into vCenter in a while. Given I could not find any results for the given event, it was back to the drawing board. This time, I repeated the same query as before, but over a larger time range. My hypothesis was that I would see a sudden spike in error messages when the issue first started. It turned out I was correct:
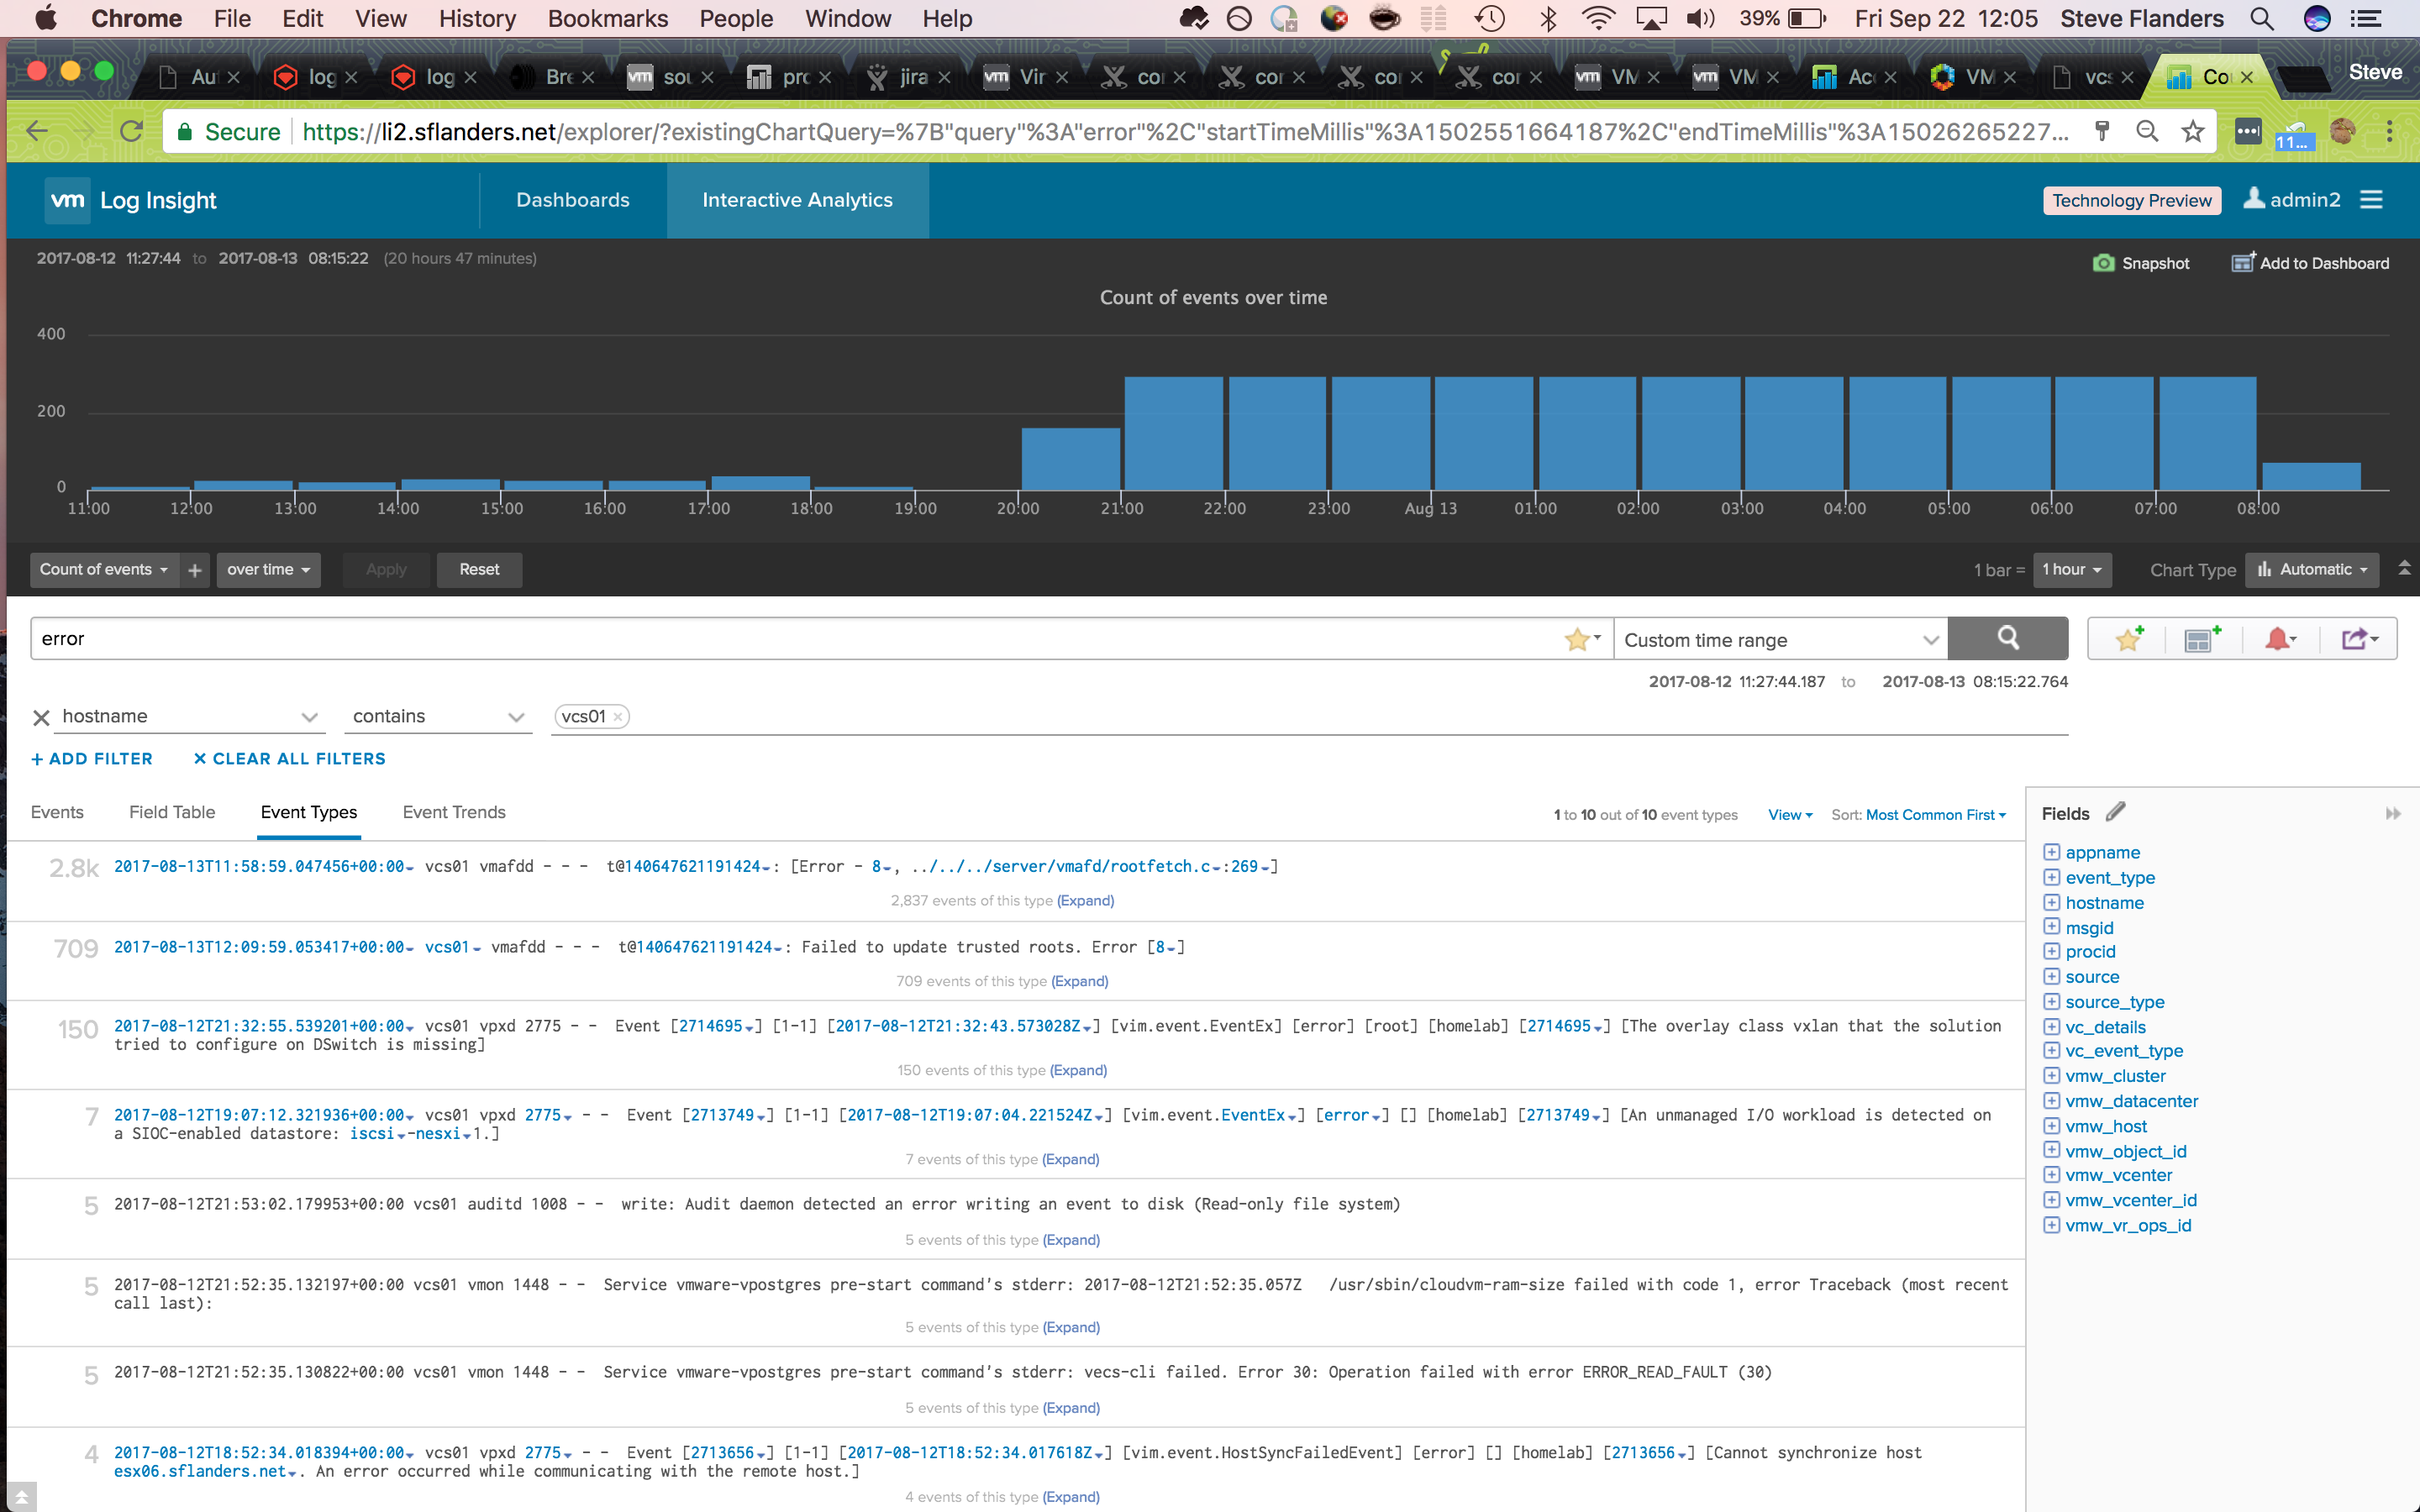
Now, I could narrow into the time range (by clicking, dragging, and clicking again on the bar chart) to pinpoint what was going on at that time:
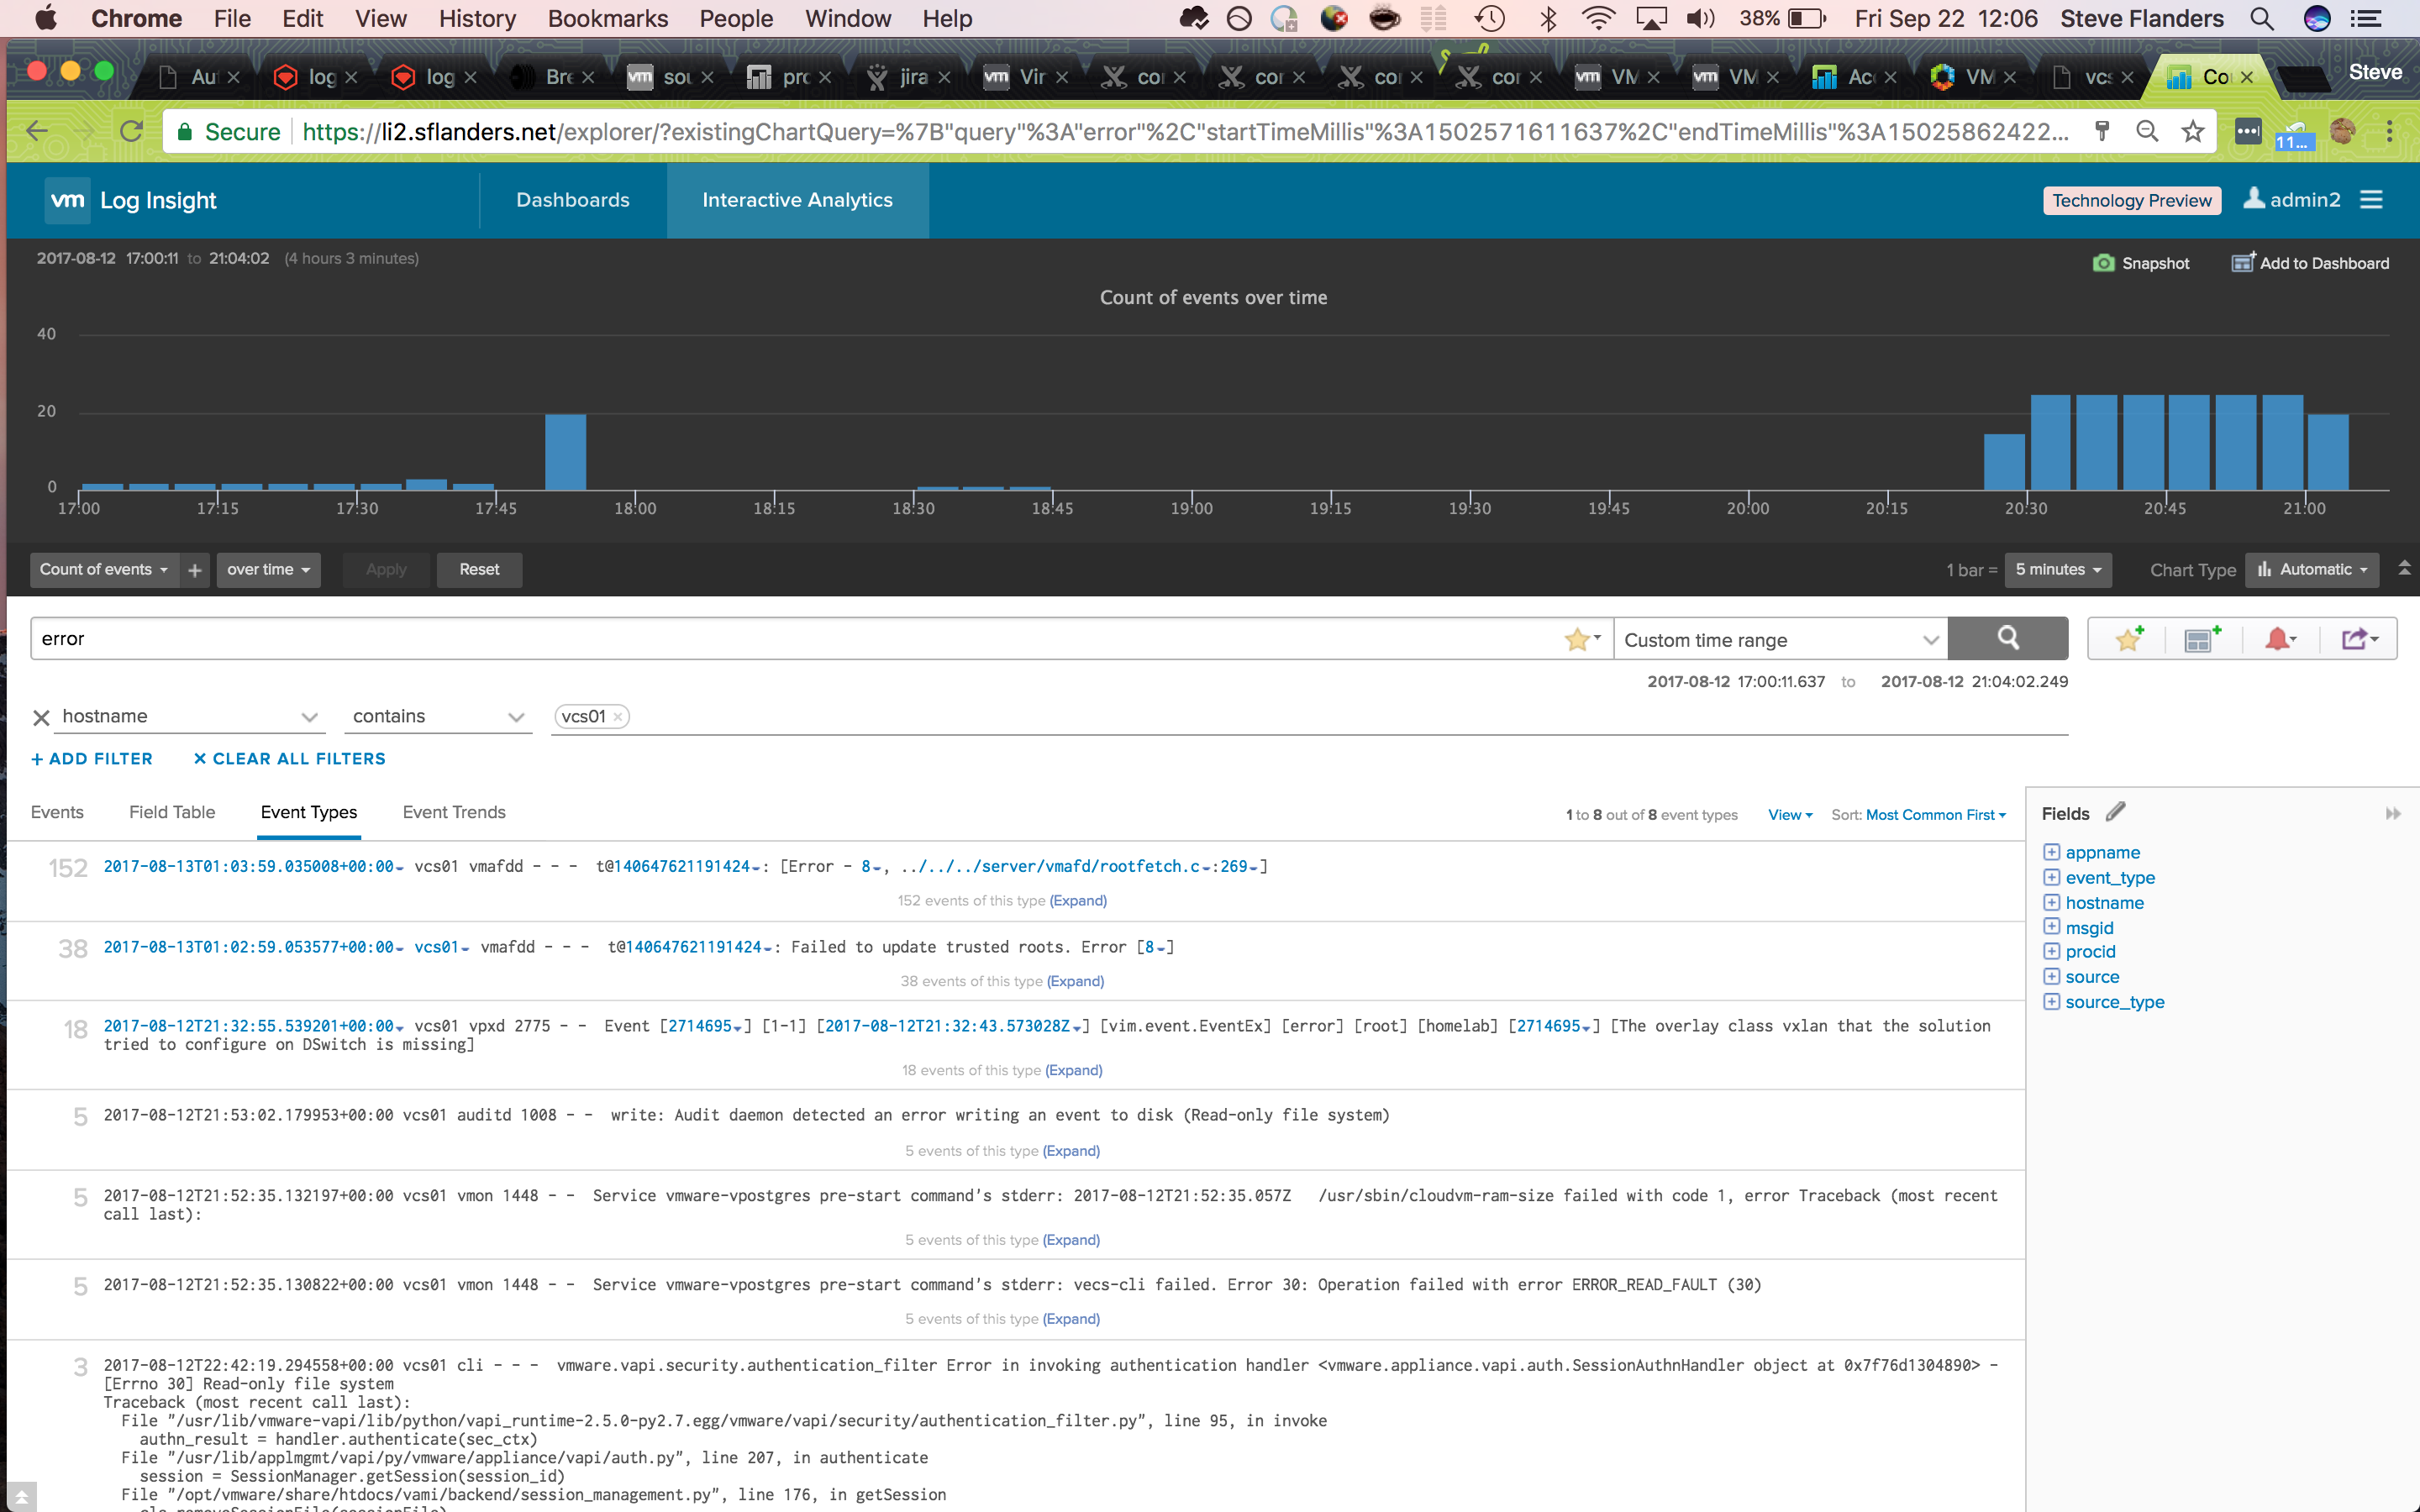
Looking over the event types I could see a different example of a read-only event. Given this, I decided to add “read” and “only” to my search query as I continued to narrow into the first occurrence of the issue:
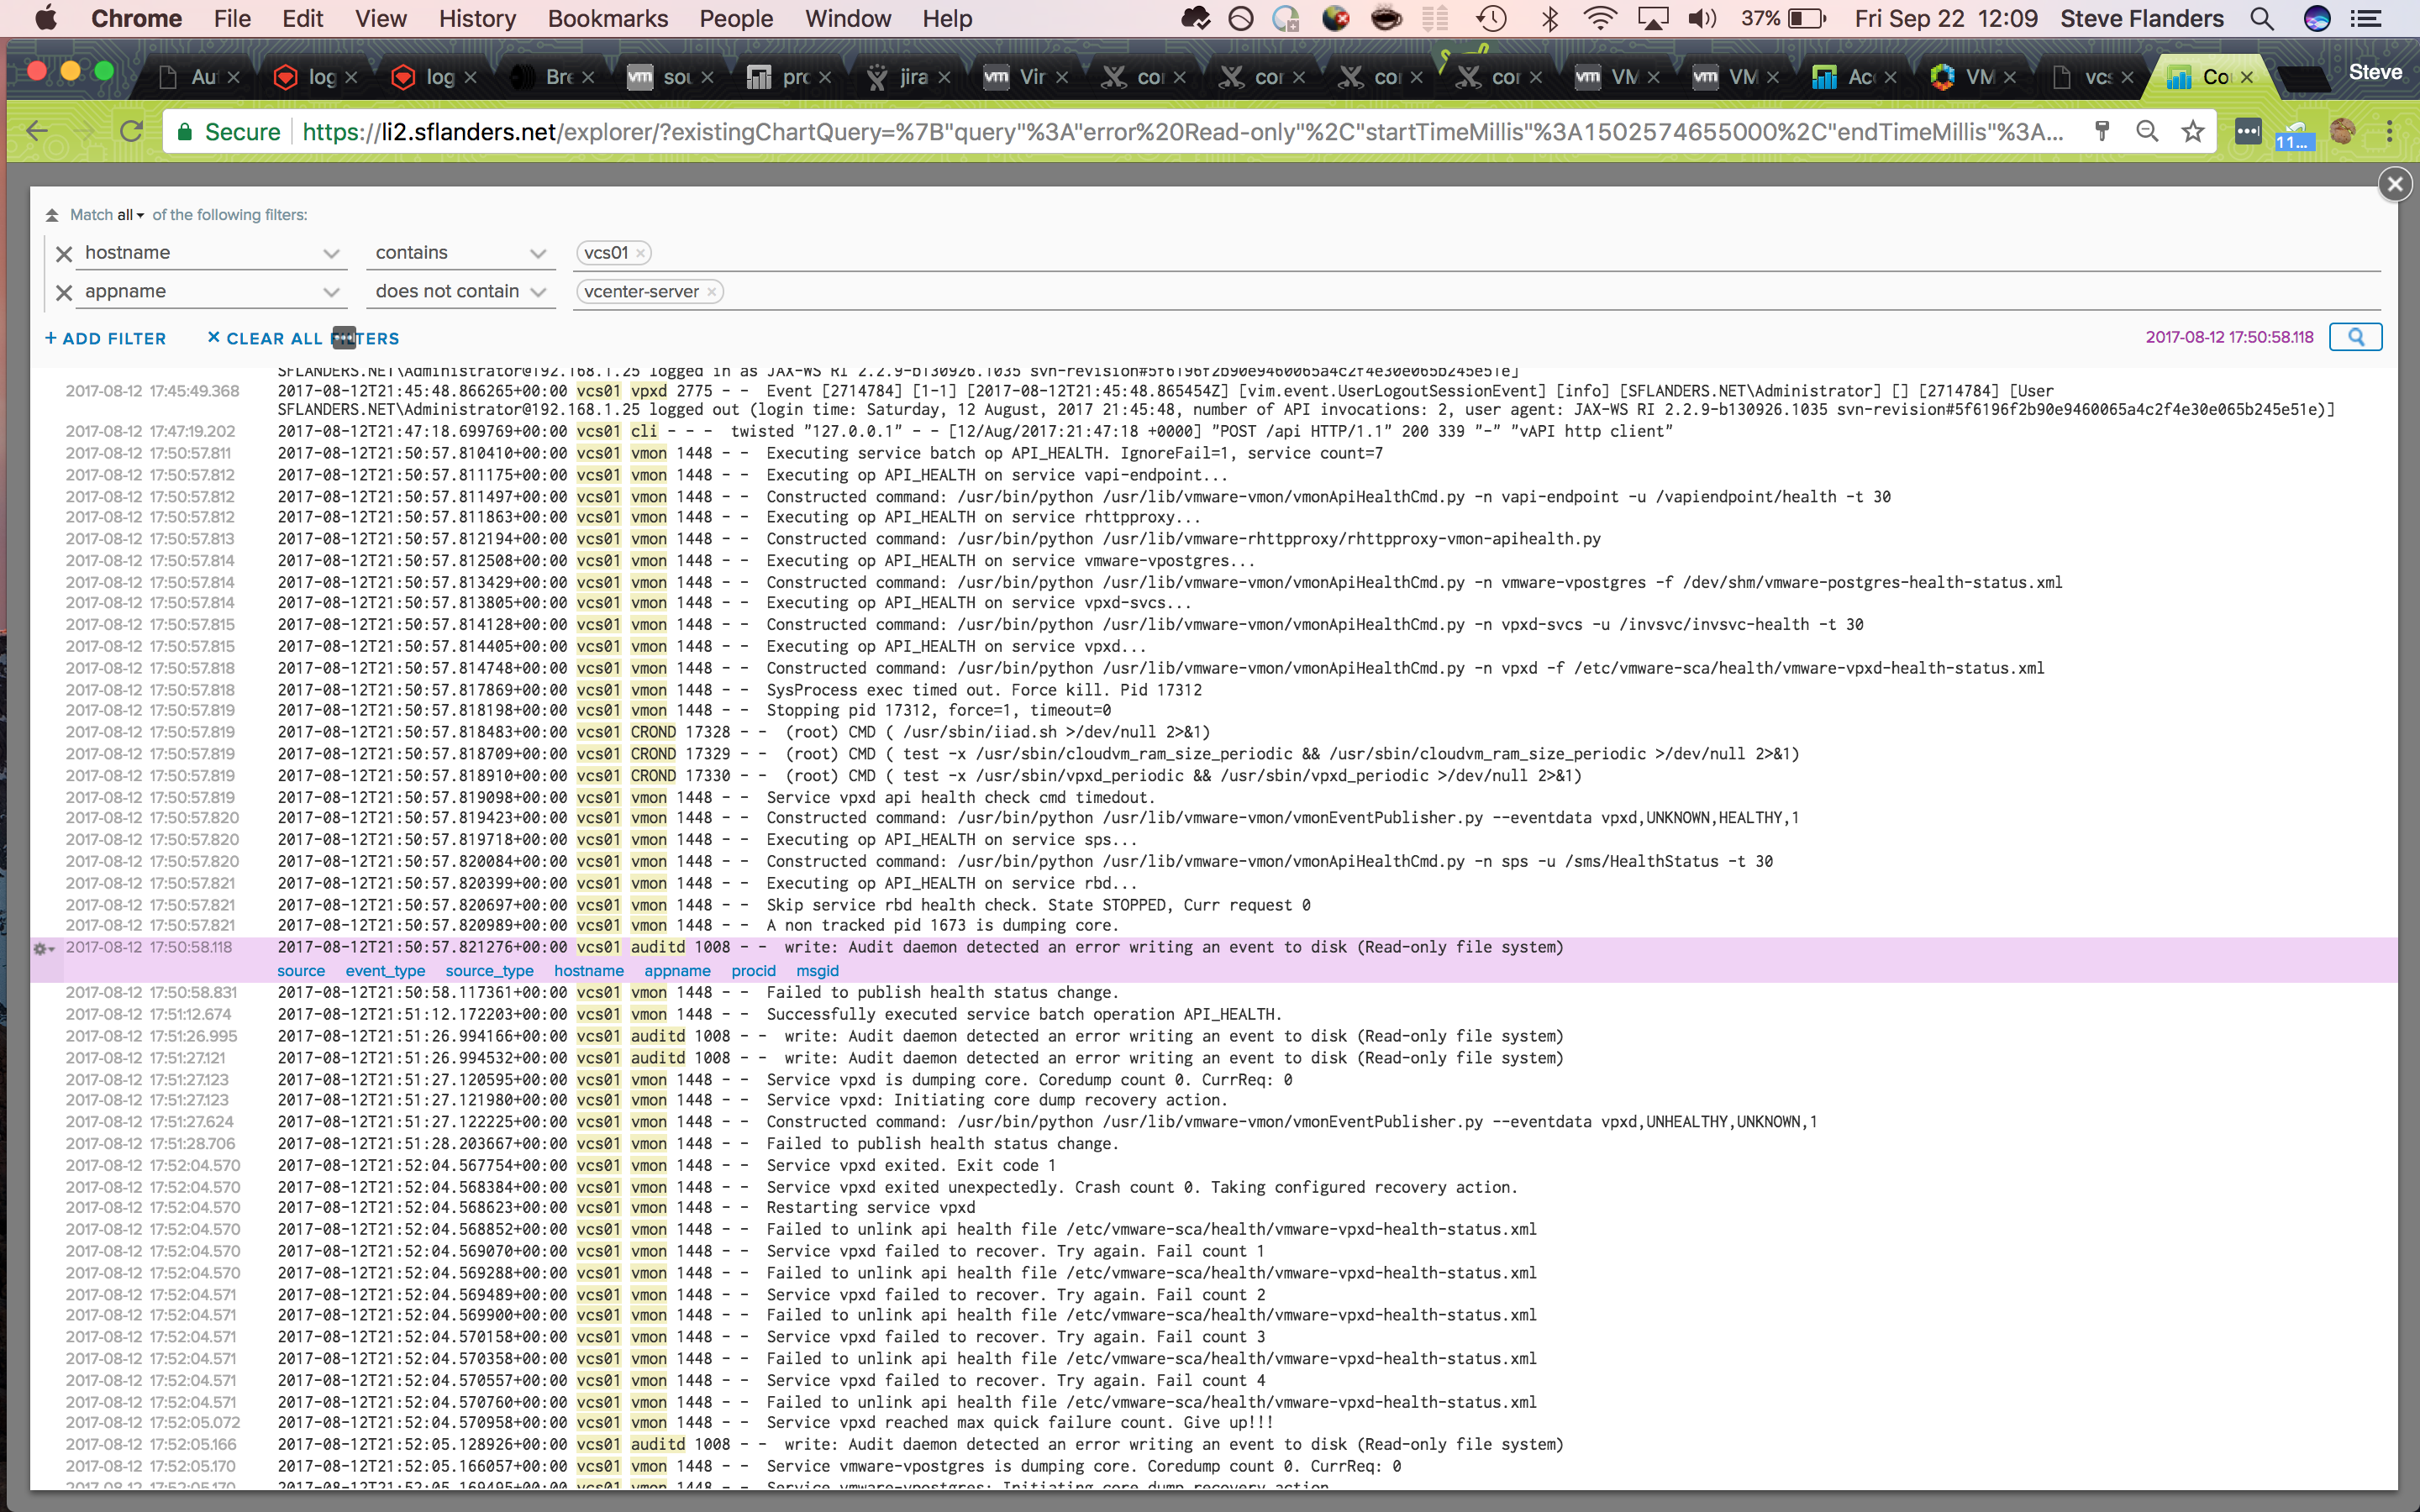
With the first occurrence of a read-only event narrowed down, I switched to the Events tab, changed the sort to Oldest First and selected the gear icon to the top result in order to View Event in Context:
Getting to a root cause
I looked, but could not see any issues reported by vCenter before the read-only event. This led me to believe that the root cause was likely infrastructure related. To confirm this, I added my Synology device to the query as it was hosting the storage for my vCenter:
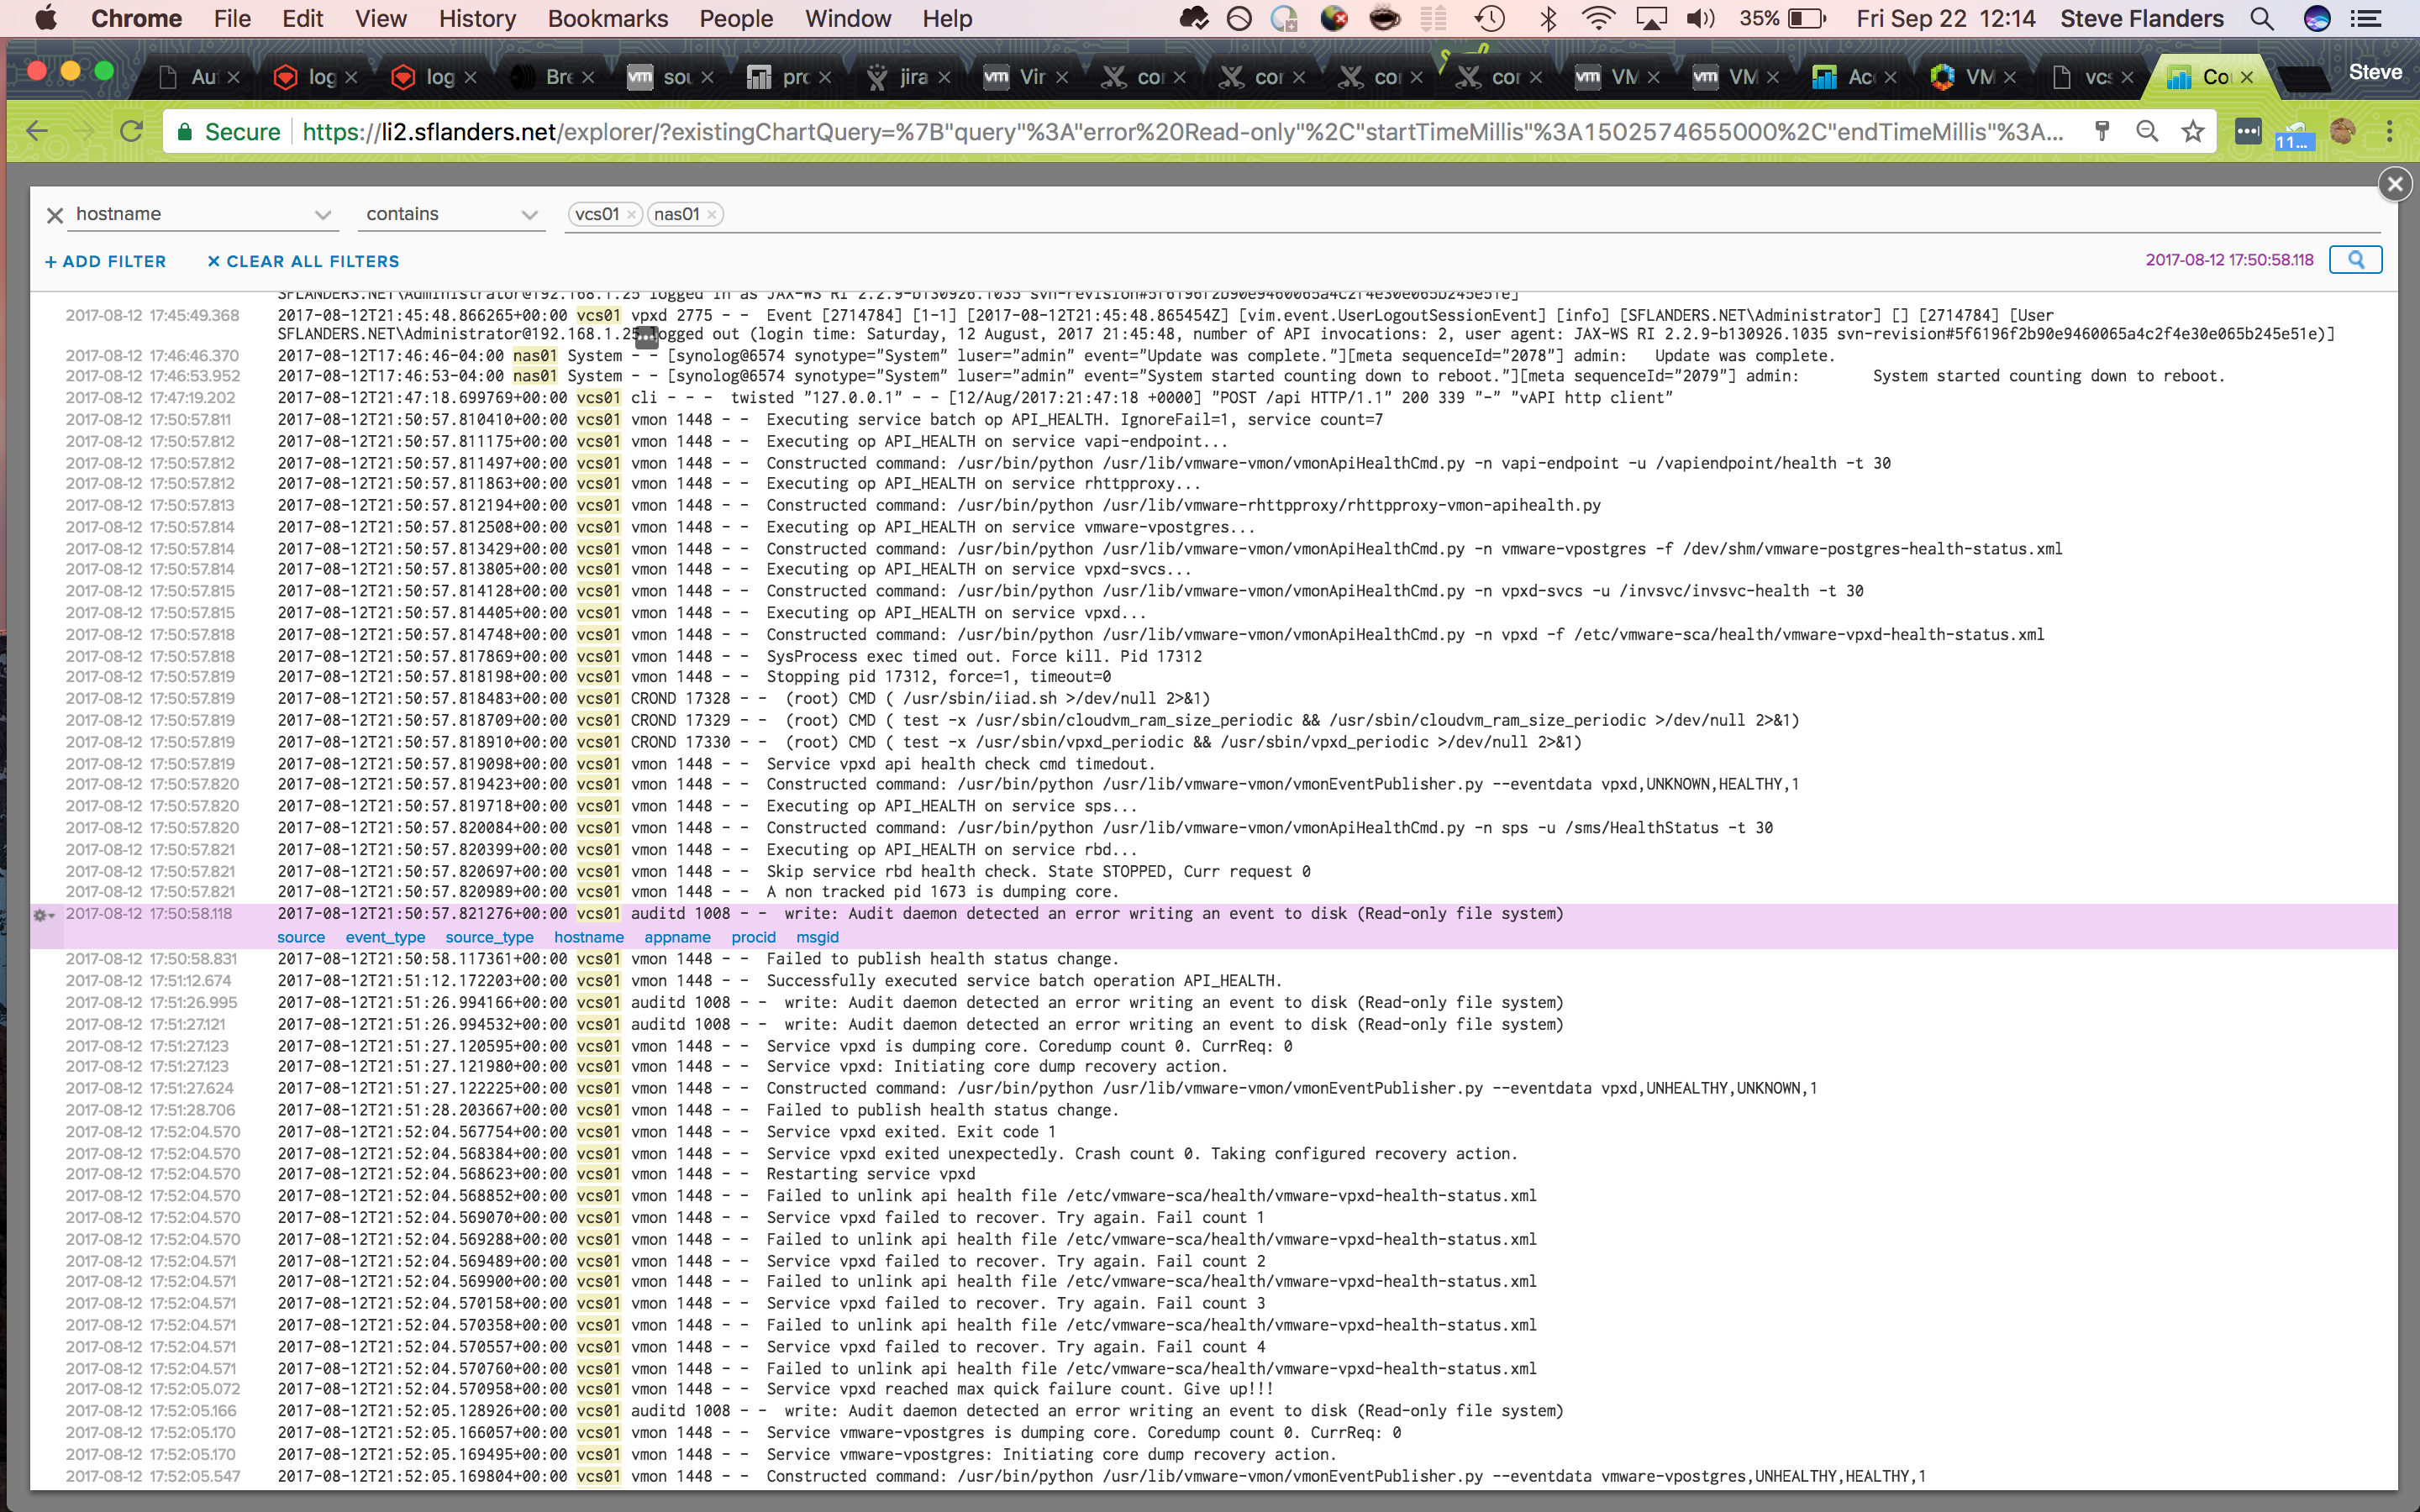
Look at that! Almost three minutes before the read-only event the Synology had rebooted for an upgrade. The admin user had upgraded the Synology device, which resulted in a Synology reboot, which resulted in the vCenter going read-only. I now had a timeline of events as well as a root cause to my issue. With this information, I rebooted my vCenter to bring it back online.
As it turns out, all the information I searched for is available in the vSphere and Synology content packs. Given I know my environment topology, I could create a custom dashboard that shows Synology and vSphere data combined. In addition, I can enable alerting for both Synology restarts in the Synology content pack and a read-only filesystem in the General content pack. Needless to say, if this happens again I will know immediately what happened.
© 2017, Steve Flanders. All rights reserved.