
Do you use log messages to troubleshoot issues and perform root cause analysis? Have you ever opened a service request with VMware or any other vendor and been requested to upload a support bundle? If you answered yes to the second question then you should have answered yes to the first. What many people do not realize is that log messages typically provide as much information as traditional monitoring tools and are often used by support teams to resolve an incident. In addition, log messages are usually easier to understand than monitoring tools such as SNMP that require you to translate information like those found in MIBs.
Today, VMware announced a new product that allows administrators and executives to get better insight into their environments via log messages. The product is called vCenter Log Insight and it is a log aggregation, correlation, reporting, and monitoring tool specifically tailored for VMware products.
Why would VMware want to get into this market?
Background
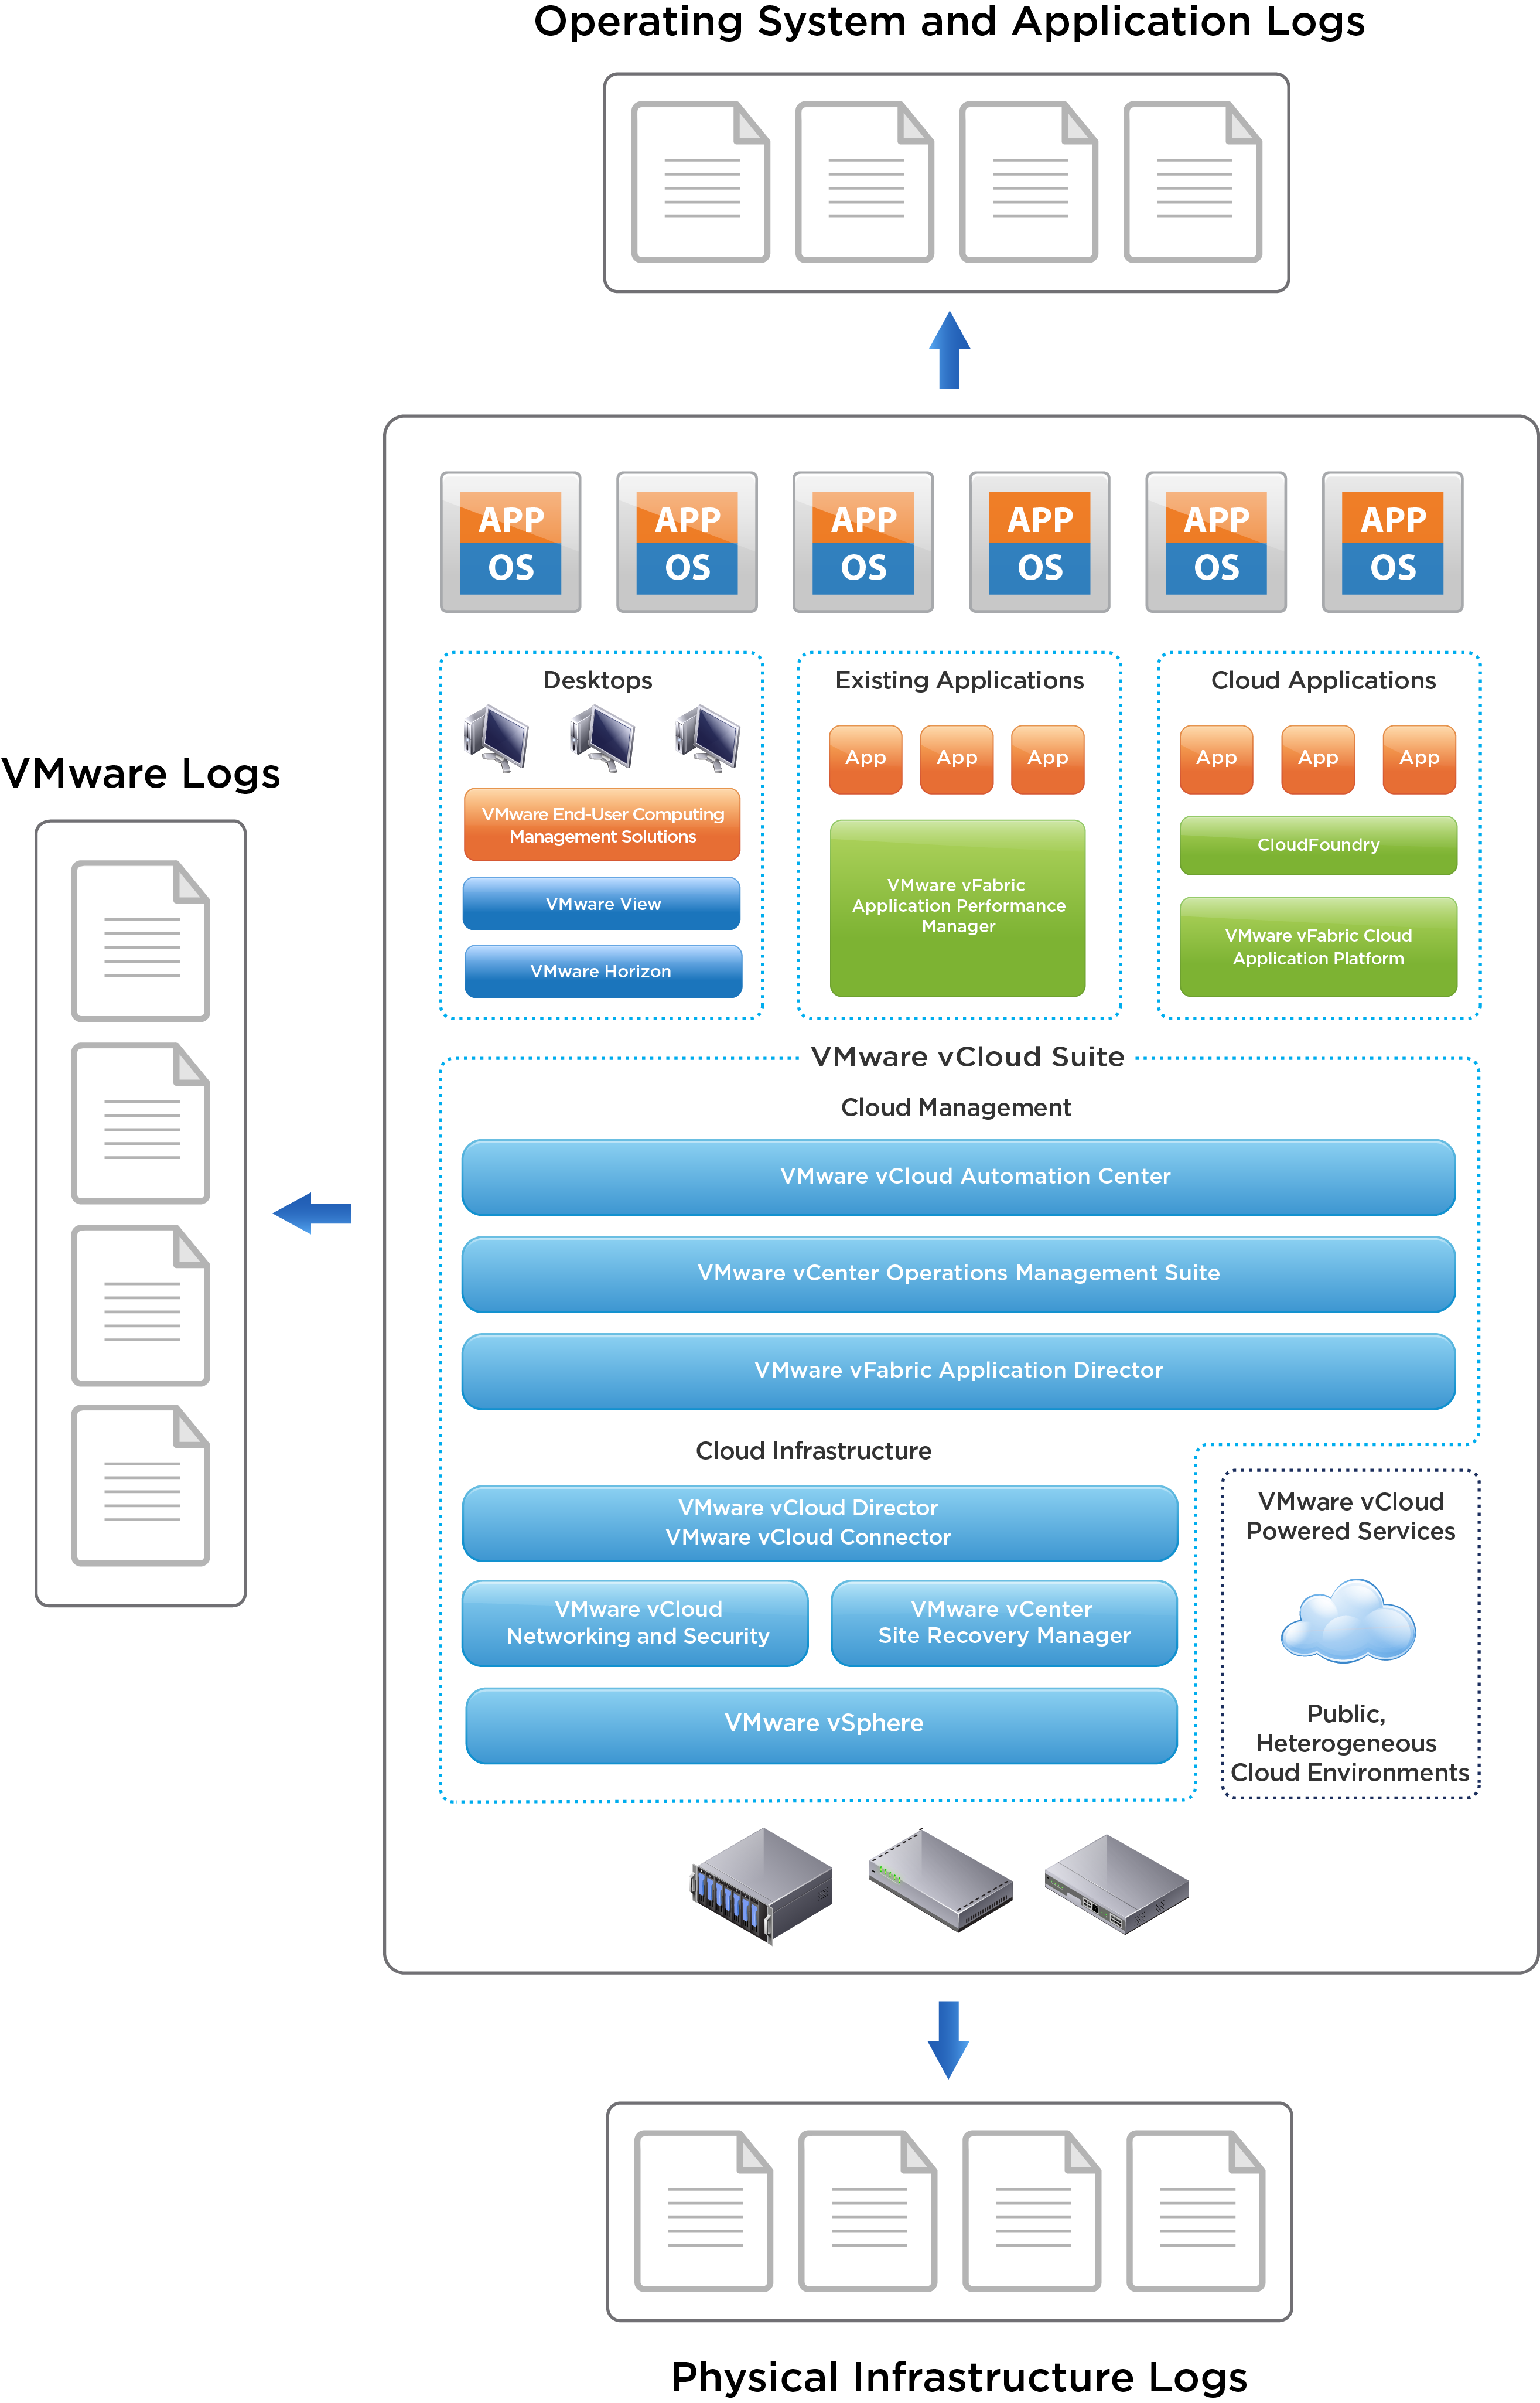
Let’s start with the problem statement: Every device on which VMware product is deployed on generates log messages, every VMware product generates log messages, every VM that runs on top of VMware products generates log messages, and every application running in a VM generates log messages.
The volume of log messages is usually dependent on two factors:
- Environment growth: More devices = more logs
- Environment issues: Problems in the environment usually result in more log messages or the need to increase the verbosity of logging, which results in more log messages
Log messages provide a wealth of knowledge. Log messages report on areas such as health, performance, inventory, events, and auditing. Now let’s say you want to look at the log data. While analyzing log messages from a single device or even a single component on a single device is great for quick troubleshooting and knowledge gathering, it can be time-consuming and tedious. What if you want to query over log data from multiple systems or correlate an issue throughout your environment? The relevance of this question is more apparent with pseudo examples:
- You know when you see a log message that contains X that it means Y is going to happen and you want to see what devices experience X and when
- If device A has message X and device B, which connects to device A, has message Y then the problem is Z
The pseudo examples above should ring a bell for administrators, but what about executives? In addition to providing aggregation and correlation, log messages can also be used to generate dashboards and alerts. Traditional logging agents like rsyslog and syslog-ng do not include dashboarding or alerts by default. Dashboards are great from both reporting and trending aspects, while alerting can be used for monitoring an environment in addition to reporting and trending. Dashboards and alerts can also be used to provide information about a particular type of log message. All of this information is critical to executives.
Overview
As mentioned before, vCenter Log Insight is a log aggregation, correlation, reporting, and monitoring tool specifically tailored to VMware products. Now that you know about the problem the product is solving, you probably want to know more about the product. In my next series of posts, I will be covering installation, configuration, and usage of the product so for now let me just provide a brief overview.
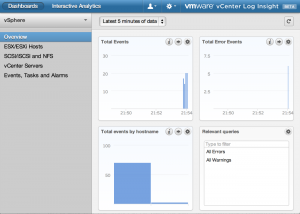
vCenter Log Insight is available as a virtual appliance and can deployed on any system that supports the OVF standard. The primary interface with the product is through its HTML 5 web interface. By default, you log into the dashboard section and are presented with immediate product value by getting information about your VMware environment through the vSphere content pack. Content packs are a combination of pre-defined extracted fields, queries, functions, groupings, dashboards, and alerts for a specific application or product. The dashboard pages provide insight to the type of log messages being sent in your environment. Administrators, engineers, and monitoring teams can leverage dashboards for trending and troubleshooting while managers and executives can leverage dashboards for reporting and statistics.
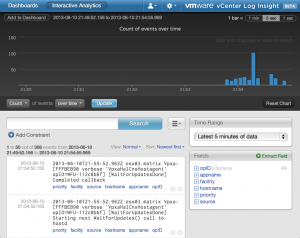
In addition to the dashboard pages is the interactive analytics page. This is where administrators, engineers, and monitoring teams will spend a majority of their time. On this page, log messages can be displayed in a variety of ways including visually via functions and groupings and textually via queries and constraints. In short, the interactive analytics page allows for the restriction and manipulation of log messages for information gathering and root cause analysis.
As you can see, vCenter Log Insight is a powerful tool that can be used to aggregate, correlate, report, and monitor your environment using log messages. The product offers integration with VMware products including vCenter Server and vCenter Operations Manager and provides knowledge into your virtual infrastructure through the vSphere content pack. The best part is that announcement made today also included a free public beta of vCenter Log Insight. I would highly recommend you take advantage of this opportunity and download the beta available here: http://communities.vmware.com/community/vmtn/vcenter/vcenter-log-insight.
UPDATE: Be sure to check out Jon Herlocker’s post: http://cto.vmware.com/introducing-vmware-vcenter-log-insight
© 2013 – 2021, Steve Flanders. All rights reserved.
Hi – this looks great, we were literally only talking this morning about the Syslog Collector and its deficiencies – very much looking forward to trying this out.
The default for this is 2cpu/8GB RAM for up to 20 hosts – can I ask why it’s so hefty? I appreciate it’s crunching the data but it still seems excessive and hard to justify – e.g. the Syslog Collector runs on a Windows 2008R2 host with 1vCPU and 4GB RAM and services all 280 hosts without much effort?
It looks awesome 🙂
Hey Sam – Thanks for the comment! The reason for 2 vCPU is because of the type of queries that are issued against the data (difference from the syslog collector). As for memory, the XS configuration should be fine with as little as 2GB of memory. The memory configuration defaults to 8GB as reducing it requires a change to the Java heap memory used by the product. For more information, take a look at: http://communities.vmware.com/servlet/JiveServlet/previewBody/23714-102-1-31648/VMware-vCenter-Log-Insight-1.0-Beta-Virtual-Appliance-Sizing.pdf.