Another new feature in the Log Insight 2.0 beta is dashboard filters. What are dashboard filters, how do you create them, and how do they impact content packs? These are the questions I will answer in this post!
![]()
Constraints -> Filters
In Log Insight 1.x, the Interactive Analytics page had the ability to refine queries through the use of constraints. Constraints are similar to database constraints in that they provide a more powerful way of refining a query. In Log Insight 2.0, constraints have been renamed to filters.
![]()
What are dashboard filters?
Dashboard filters are what were referred to as constraints on the Interactive Analytics page, but on the Dashboards page.
How do you create dashboard filters?
Just like on the Interactive Analytics page! In fact, dashboard filters only differ from Interactive Analytics filters in two way:
- The default field is hostname instead of text
- The match operator is not available on the Dashboards page
The two primary ways to create dashboard filters are listed below. For more information on filters (on the Interactive Analytics page, but same applies to the Dashboards page), see this post.
Dynamically
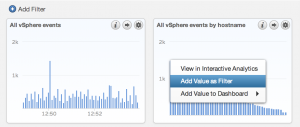
To dynamically create or modify a dashboard filter, select a bar in a dashboard widget that groups by a field other than time (e.g. on the vSphere content pack Overview dashboard, the All vSphere events by hostname widget) and select the Add Value as Filter option.

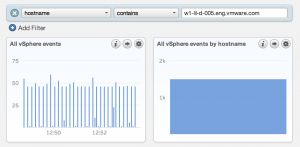
Upon doing so, a dashboard filter is created for the current dashboard. Notice how the widgets on the dashboard now look different. This is because all widgets on the dashboard have been updated to include the current filter!

Manually
You can also specify any filter manually by selecting the Add Filter button and filling in the appropriate fields.

How do dashboard filters impact content packs?
Dashboard filters can be saved as part of a content pack. As part of Log Insight 2.0, a new General content pack is included and the content pack includes saved dashboard filters. You will notice that dashboard filters that are part of a content pack cannot be removed. In addition, the field type cannot be modified, but the operation and the values can be. Dashboard filters are saved as part of a content pack to give the user of the content pack a suggestion for what fields may bring additional value and what fields will make it easier to drill down into events to perform deeper troubleshooting and root cause analysis.

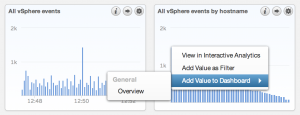
Another benefit to having dashboard filters as part of a content pack is that other dashboards (e.g. from different content packs) can access and link to the filters. For example, if a non-time series bar is selected on the vSphere content pack, an Add Value to Dashboard option is presented and the Overview dashboard of the General content pack can be selected.

Upon selecting the Overview dashboard you will be directed to the Overview dashboard and the filter will be added and applied.

Important notes about dashboard filters
Below are some important notes regarding dashboard filters and how they function.
- Dashboard filters are saved on a per-user basis. This means if a user saves a dashboard filter to a content pack another user will not see the dashboard filter when they view the same content pack.
- Dashboard filters are saved on a per dashboard (i.e. page) basis. A dashboard filter saved to a dashboard in a content pack only applies to the single dashboard and not all dashboards in the content pack.
- Dashboard filters are applied to every widget on a dashboard. If a filter is not applicable to a widget then the widget will display No Results while the filter is in place.
- Manual dashboard filters are only applied when hitting enter in the value dialog box or when selecting the Update button.
- Dashboard filters are only updated when the Update button is selected. Manually deleting a filter does not automatically update the view!
- When exporting dashboard filters as part of a content pack, the value is never saved. The reason is that content packs are meant to be generic to every environment not specific to a certain environment.
- The match any/all operator is not currently available for dashboard filters
Summary
Dashboard filters make it possible to drill down and perform deeper troubleshooting and root cause analysis from the dashboards page. Having the ability to modify multiple queries at the same time also makes troubleshooting and root cause analysis quicker and easier. In addition, dashboard linking makes it possible to tie content packs together and get true end-to-end analysis of your environment.
© 2014 – 2021, Steve Flanders. All rights reserved.
