
In this post, I would like to cover the Explore page in Log Intelligence. Read on to learn more!
![]()
Background
The Explore page of Log Intelligence has a lot of similarities to the Interactive Analytics page of Log Insight:
This page is used to query over and analyze the events themselves and the visualizations they form as well. Nearly all the functionality you have in Log Insight today is available on the Log Intelligence Explore page, including:
- Querying
- Functions
- Groupings
- Chart Types
- Event Types
- Saved Queries
- Alerts
- Fields including indexed (i.e., static) and extracted
- View Event in Context
Some missing capabilities from Log Insight today include:
- Snapshots — has pinboard instead
- URL Shortener (i.e., share link) — long URL works though
- Schema Discovery
- Event Trends
- Table View
- Export
Some new capabilities that Log Insight does not have:
- Alerts — both on visualization as well as under Events
- Pinboard
- Event Annotations
- Query collapse
Walkthrough
To walk through the Explore page, I am going to divide the page into three sections and cover the features of each section.
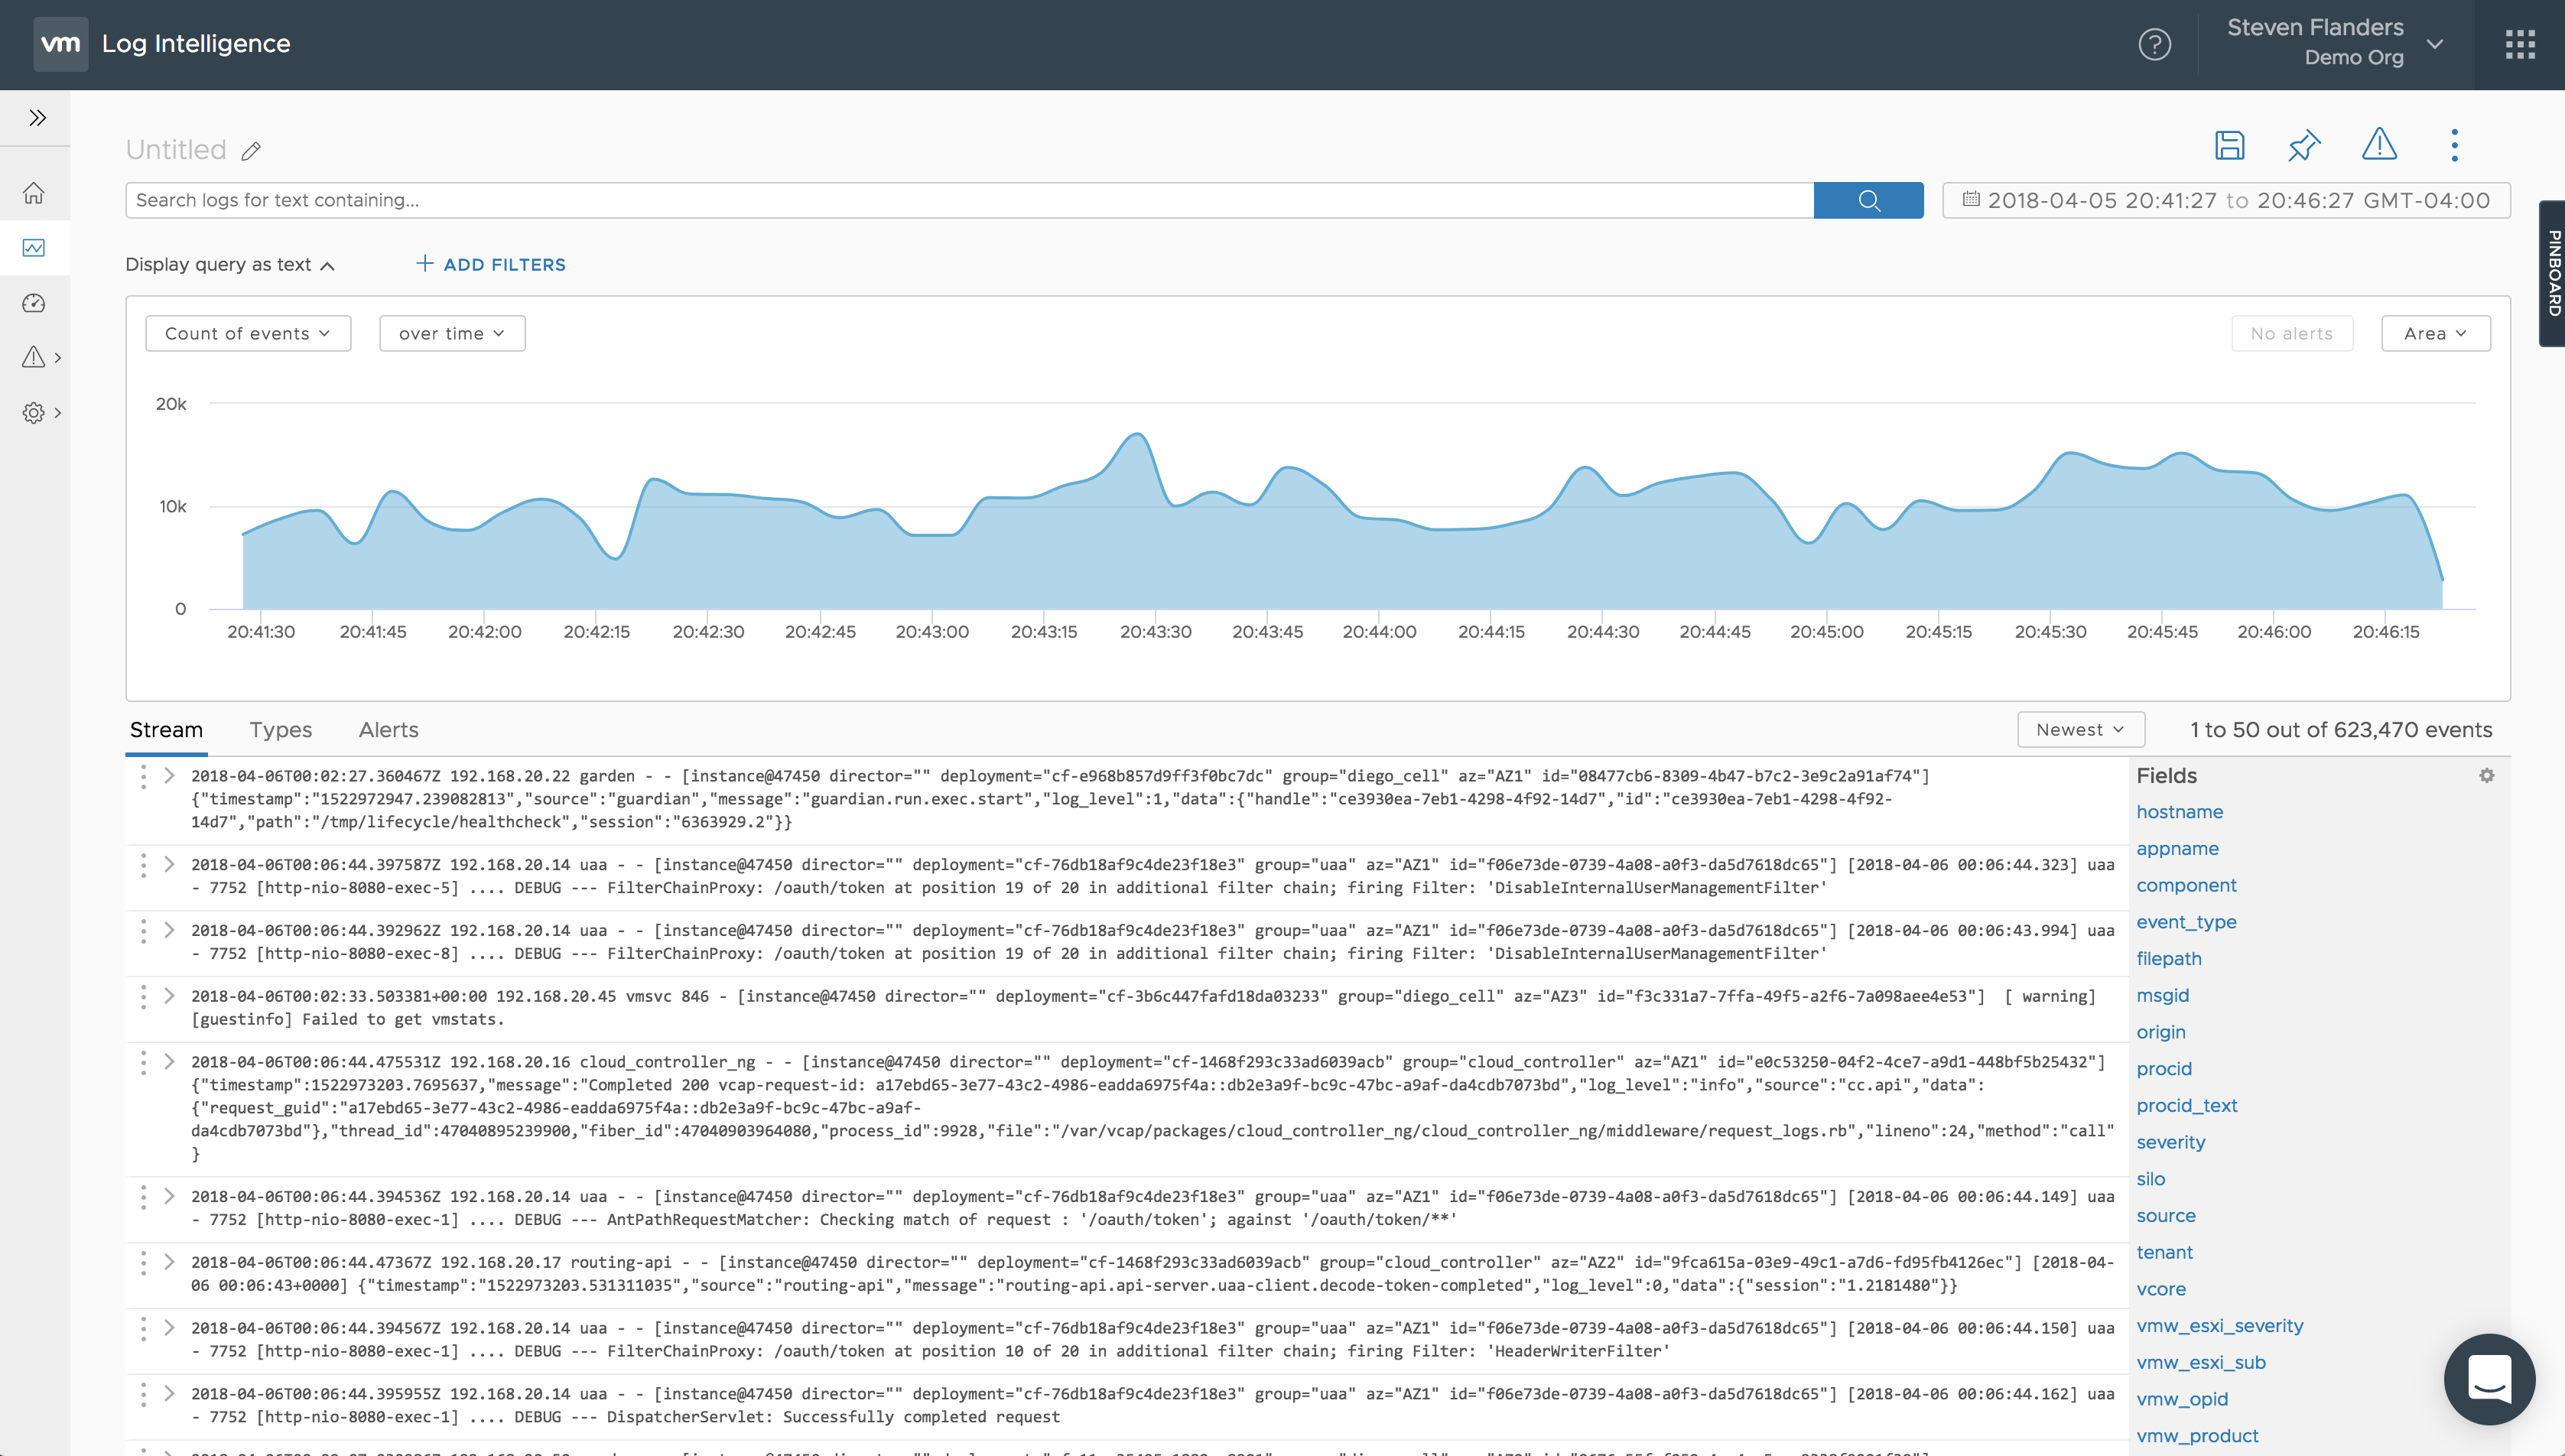
Top
At the top of the page, you have the ability to construct or edit queries:

This is done through the use of the search bar and one or more filters. Some things to note:
- Queries can be made on partial keywords where a keyword is an alphanumeric set of characters. A partial keyword query means you can search for sub-keywords. For example, if you have the hostname “us1-pod2-esx3” you can query for “esx” and get a match. (Note: This is different from Log Insight)
- Filters support a field, operator, and values. Multiple filters can be AND or OR together. (Note: This is the same as Log Insight)
- Queries can be collapsed to save screen space. (Note: This is different from Log Insight)
- The time picker is based on the timezone of the browser. (Note: This is the same as Log Insight)
In addition, you will notice you have options to:
- Save
- Pin
- Alert
- See more options
Let’s cover those options in-depth.
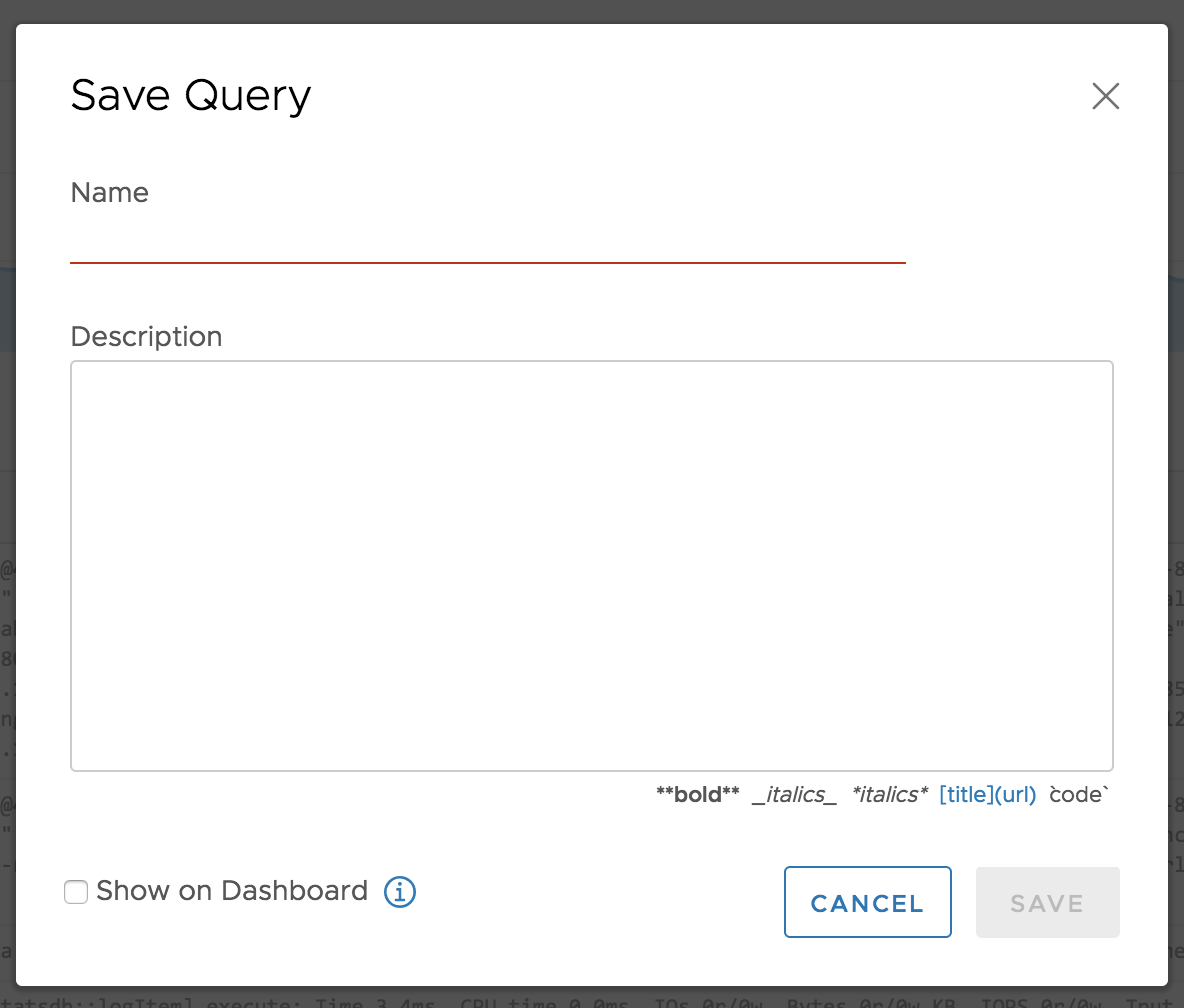
Save Query
When you save a query, you must provide a unique name.
IMPORTANT: Saved queries must have unique names.
You can optionally specify a description. You also have the option of adding a saved query to the shared dashboard (will cover in a future post).
Save Alert
Similar to saving a query, to save an alert, you must provide a unique name.
IMPORTANT: Saved queries must have unique names.
You can optionally provide a description.
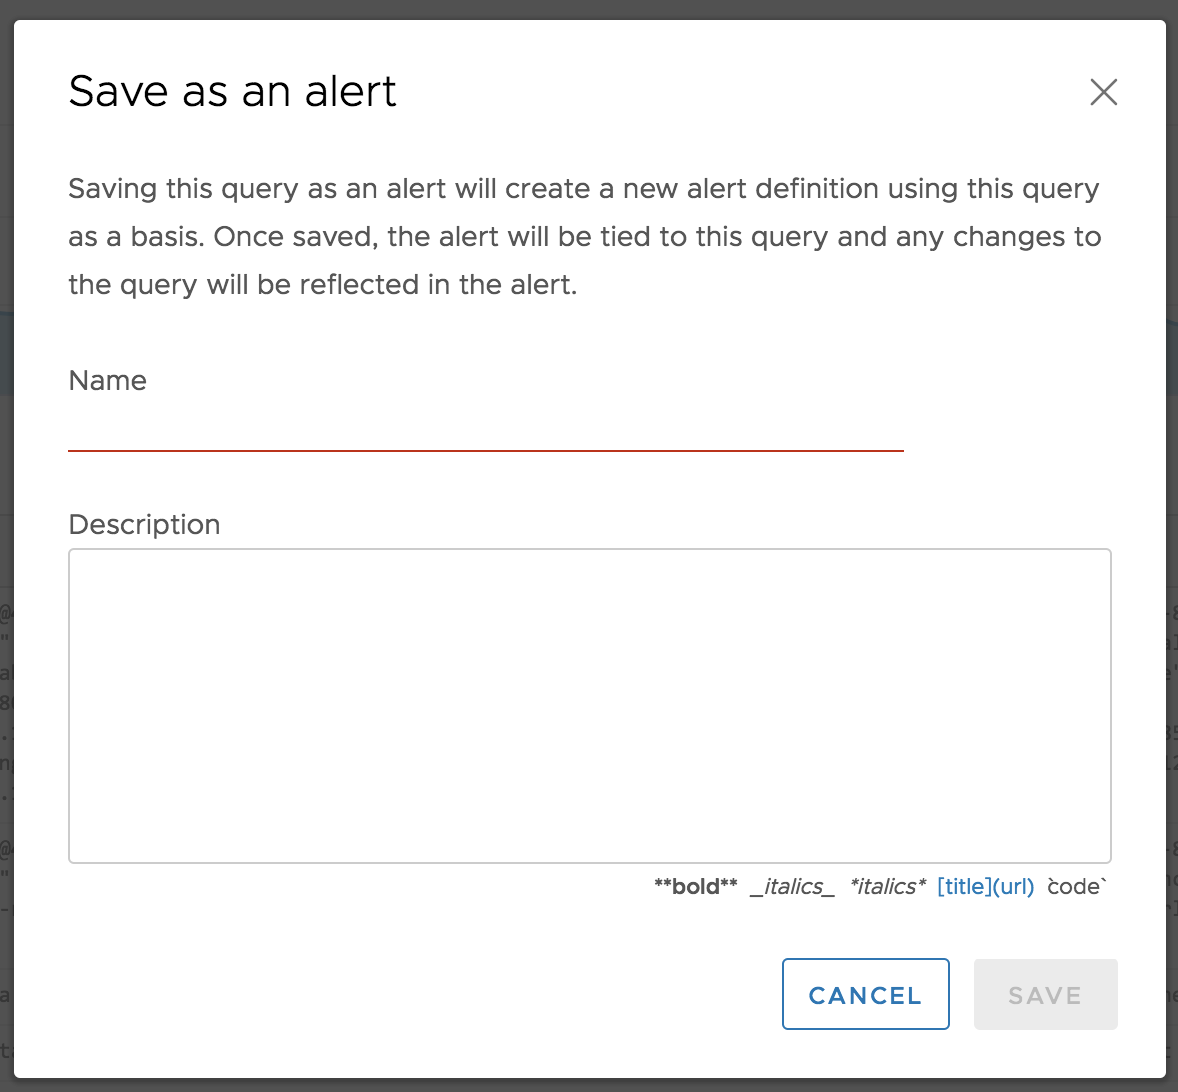
After saving an alert, you are automatically navigated to the alert so you can configure other parameters. I will cover alerts in more detail in a future post.
Pin / Pinboard
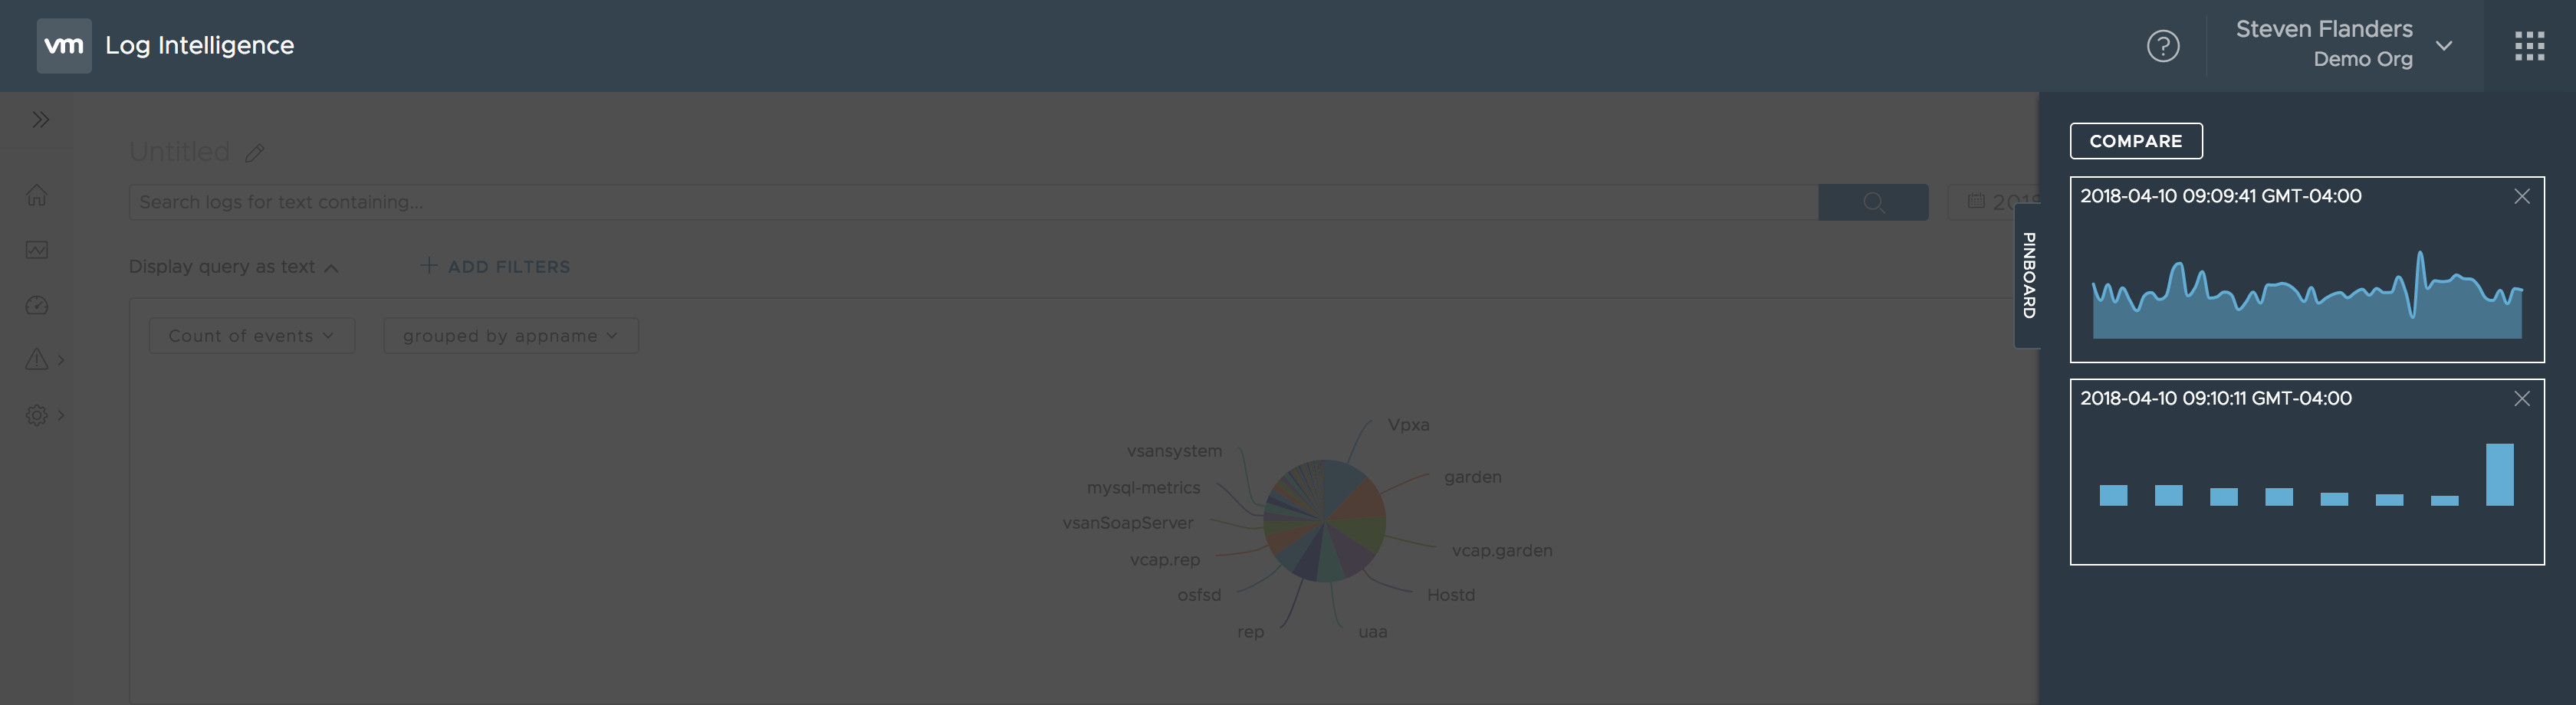
You may notice the right-hand tab on the page called pinboard. You can select the tab to pull it out, or for a given query, you can select the pin button near the top, right-hand side of the page. The pinboard and associated pins are similar to the snapshot functionality in Log Insight. Pins are temporarily stored queries for a given user. For a given query on the Explore page, you can select the pin icon to add it to the pinboard.
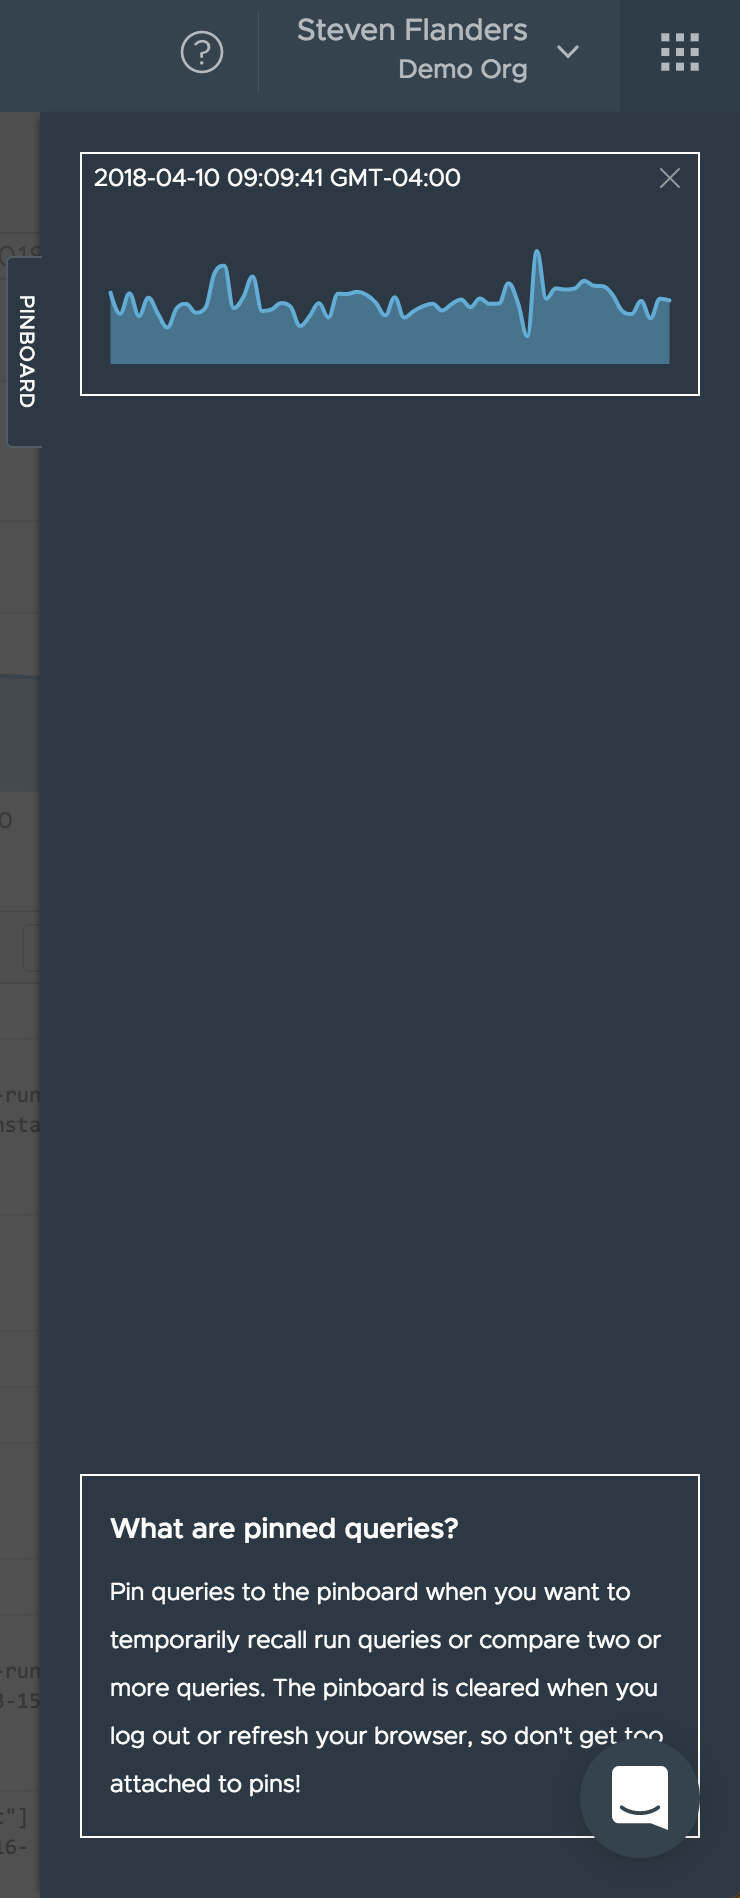
You will notice that information about pinned queries is provided on the tab.
IMPORTANT: Pins are only stored for the given browser session and refreshing the browser will clear all pins
It is important to note that the pinboard only supports a subset of the chart types today and automatically converts unsupported chart types to supported chart types (e.g., pie to bar):
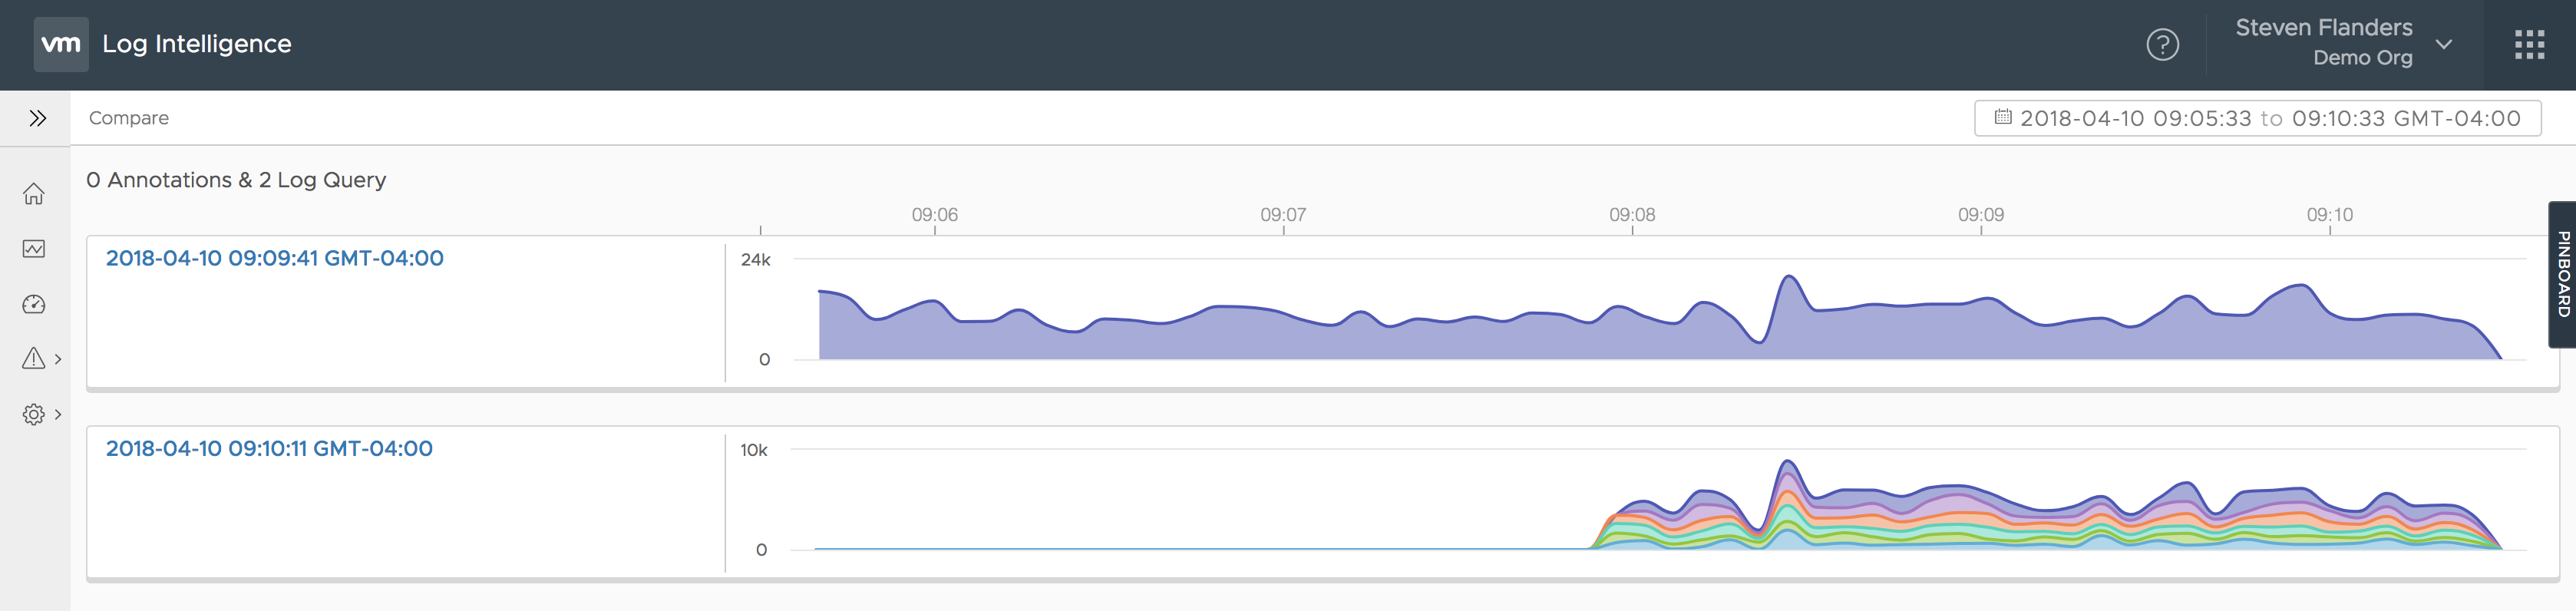
Once you have two or more pins on the pinboard, you will notice you can compare the pins. Selecting the compare button allows you to see the pins over time:
IMPORTANT: Compare on pinboard is always over time
Other Options
Finally, we have other options:
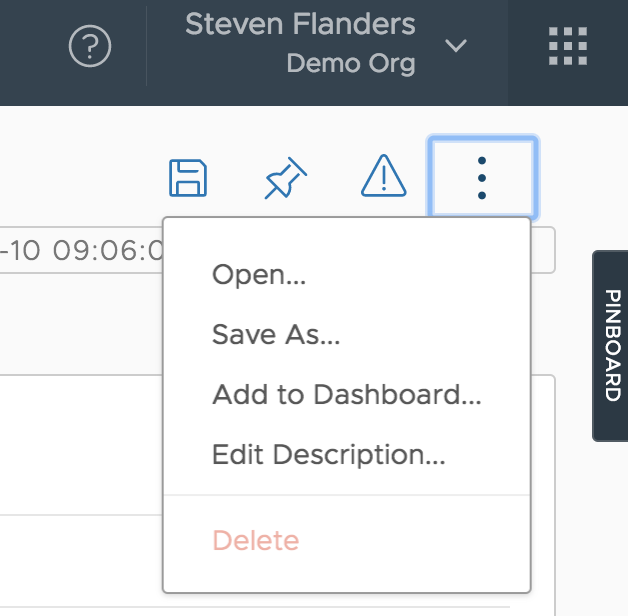
From this menu, you have the following options:
- Open — open a saved query
- Save As — similar to the Save button
- Add to Dashboard — similar to the Add to Dashboard button in the Save dialog box
- Edit Description — similar to the Save button
- Delete — ability to delete a saved query (if applicable)
Of these options, the most interesting one is Open:
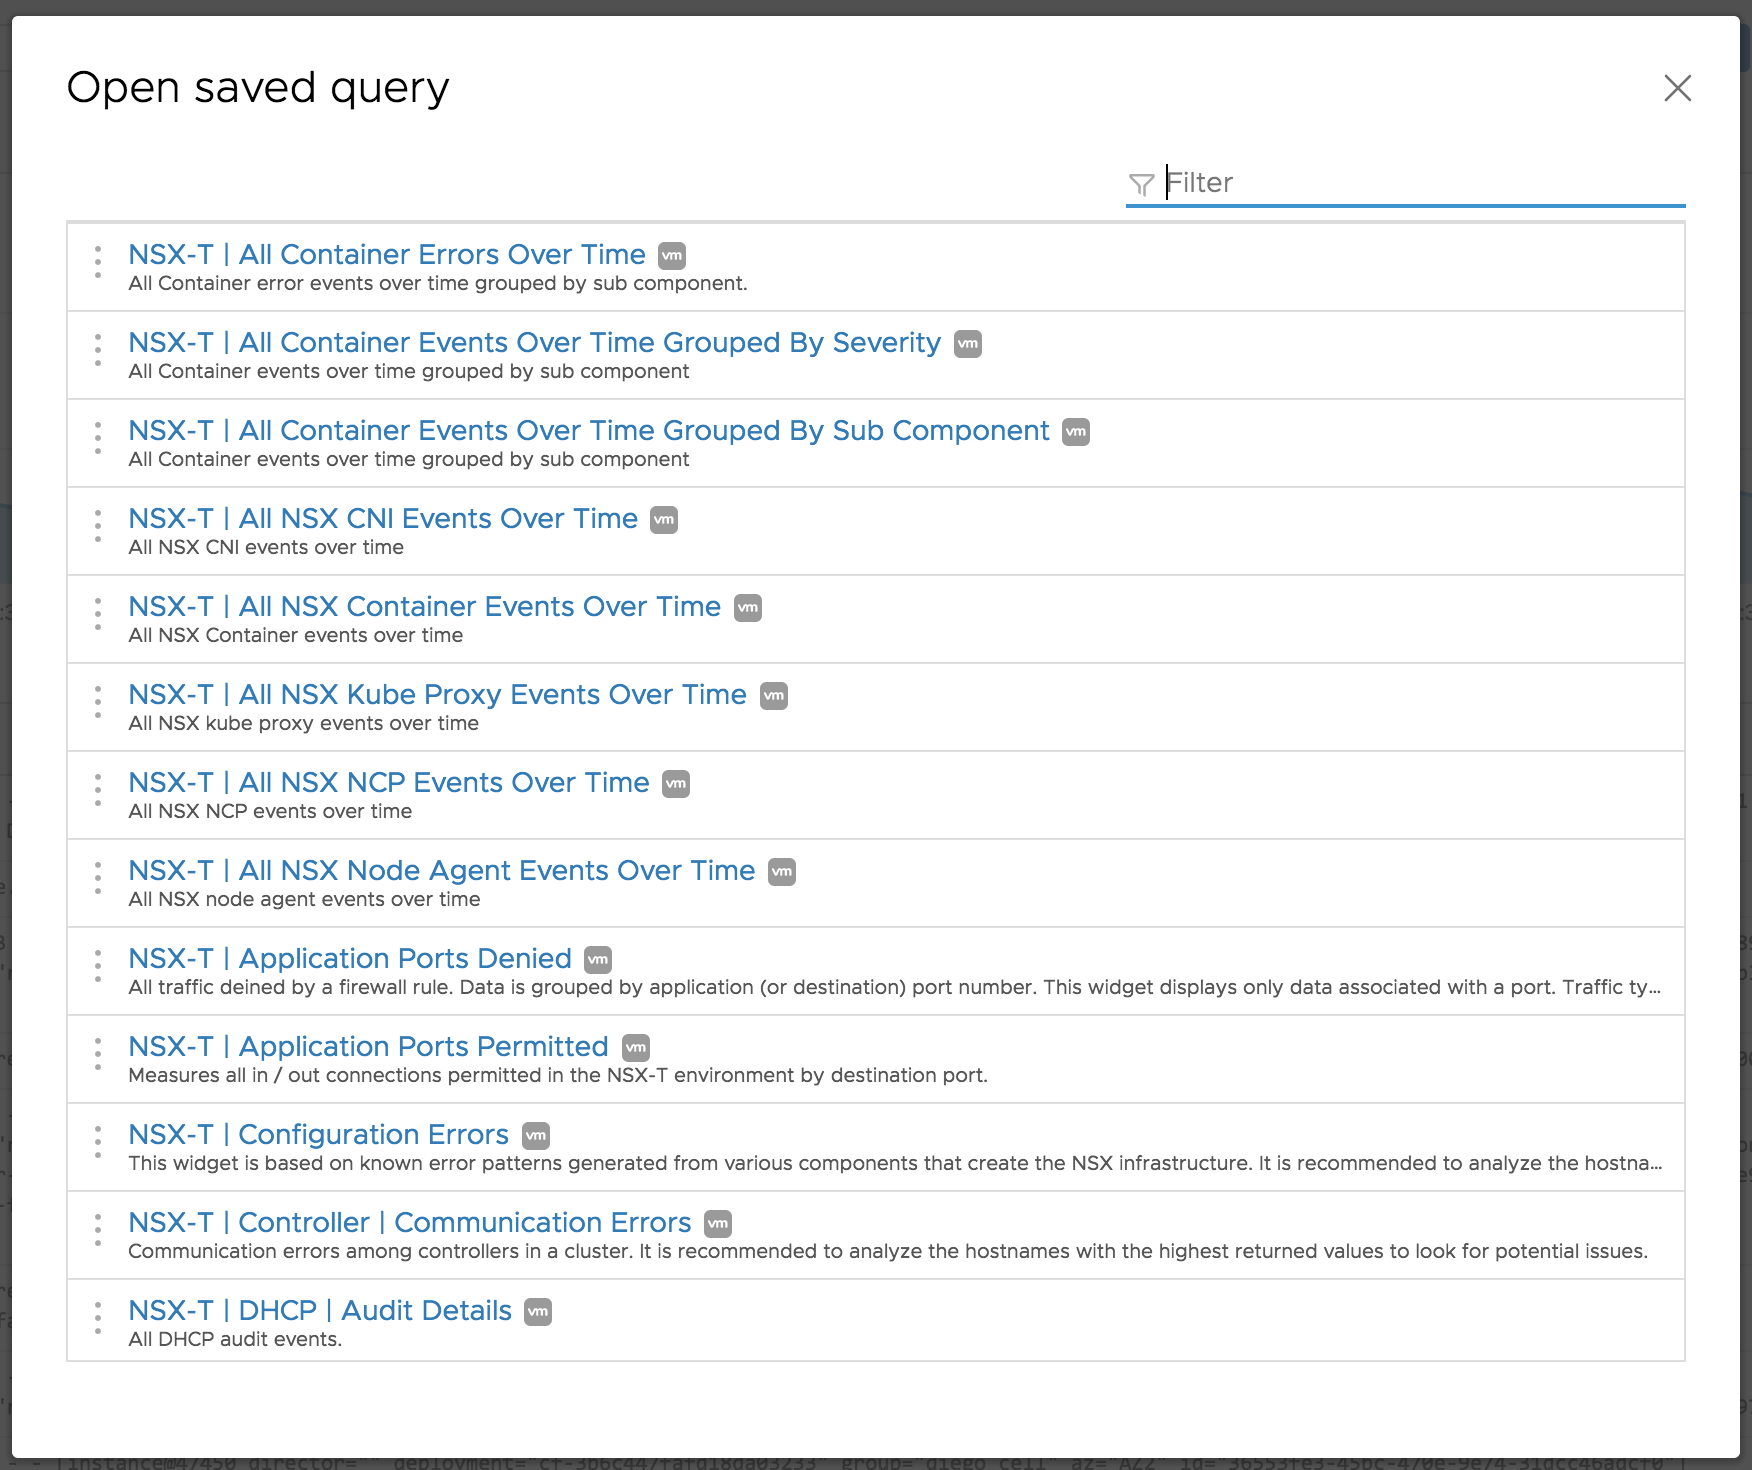
As you can see, this dialog shows all of the saved queries in the system, including content and tenant-specific. You have the option to filter to the results shown as well as open any result.
Middle
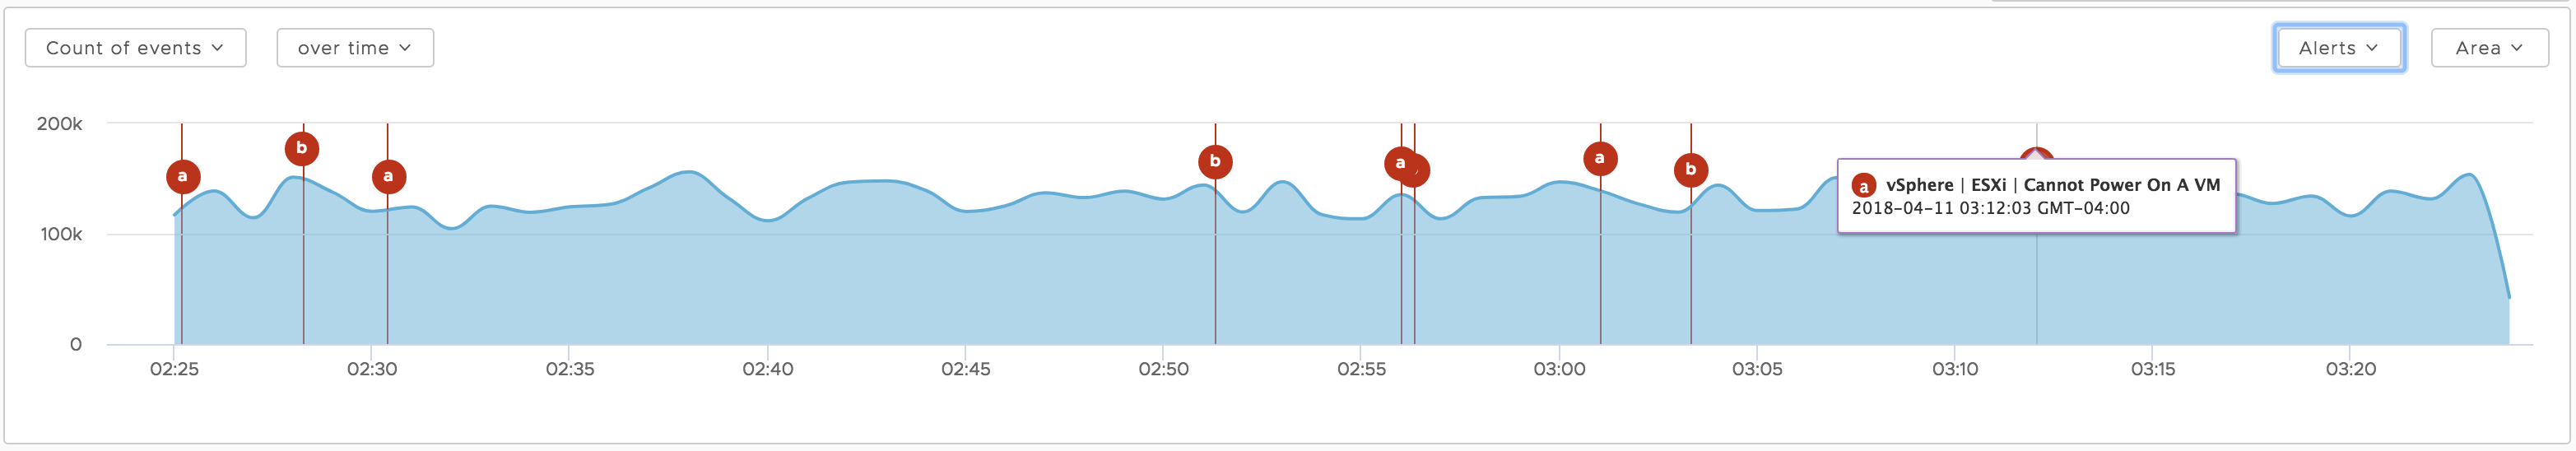
The next section of the Explore page is the chart. The chart can be manipulated to leverage mathematical functions, groupings, and with or without time. In addition, the chart type can be changed depending on the query constructed. (Note: All of this is the same as Log Insight). One cool feature is the ability to overlay alerts — from the Recent Alerts page — on top of the chart. This can be extremely helpful when troubleshooting issues. (Note: This is different from Log Insight)
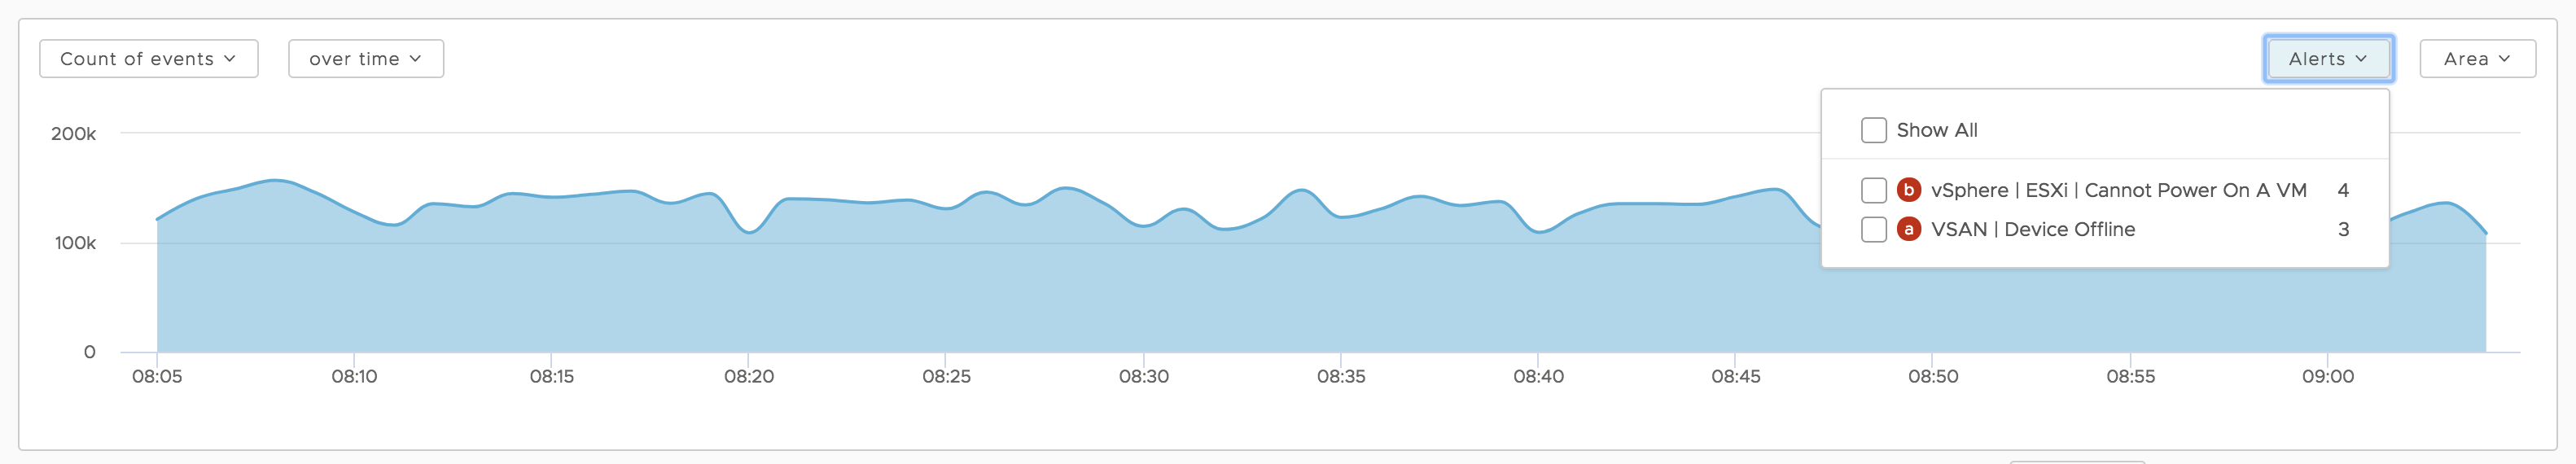 Select “Show All” to see the alerts overlaid on the chart:
Bottom
Finally, we have the events themselves.
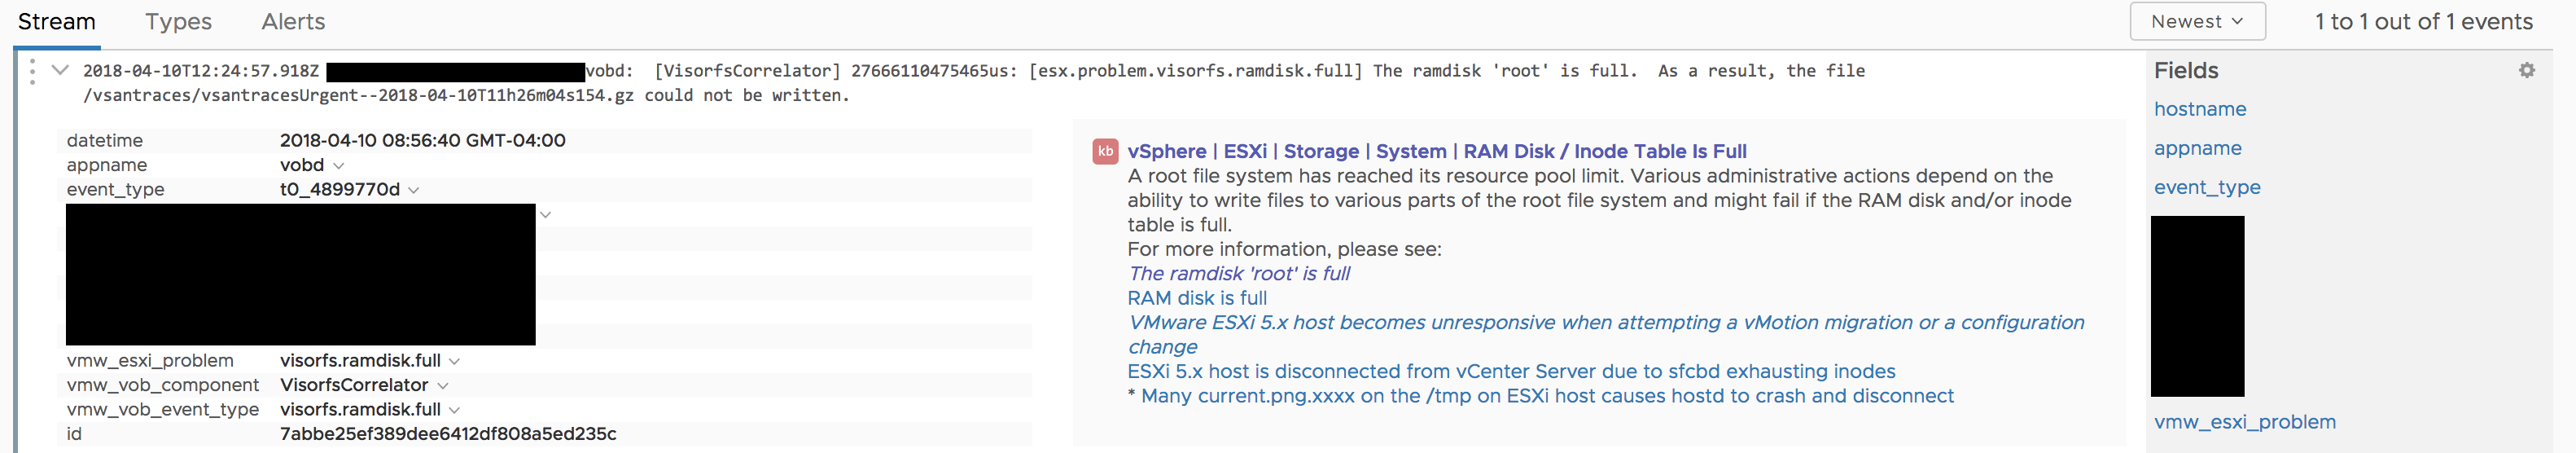
Stream
The events are shown in a “tail”-like fashion but have the ability to be expanded to show fields discovered. In addition, if an event has been annotated, then the annotation is shown on expansion. When collapsed, annotated events have a blue bar on the left edge of the event. (Note: Hidden fields by default and event annotations are different from Log Insight)
Types
You will notice that in addition to the Stream tab, you have Types and Alerts. Types are summarizations of ingested events (Note: Same as Log Insight but without schema discovery today):

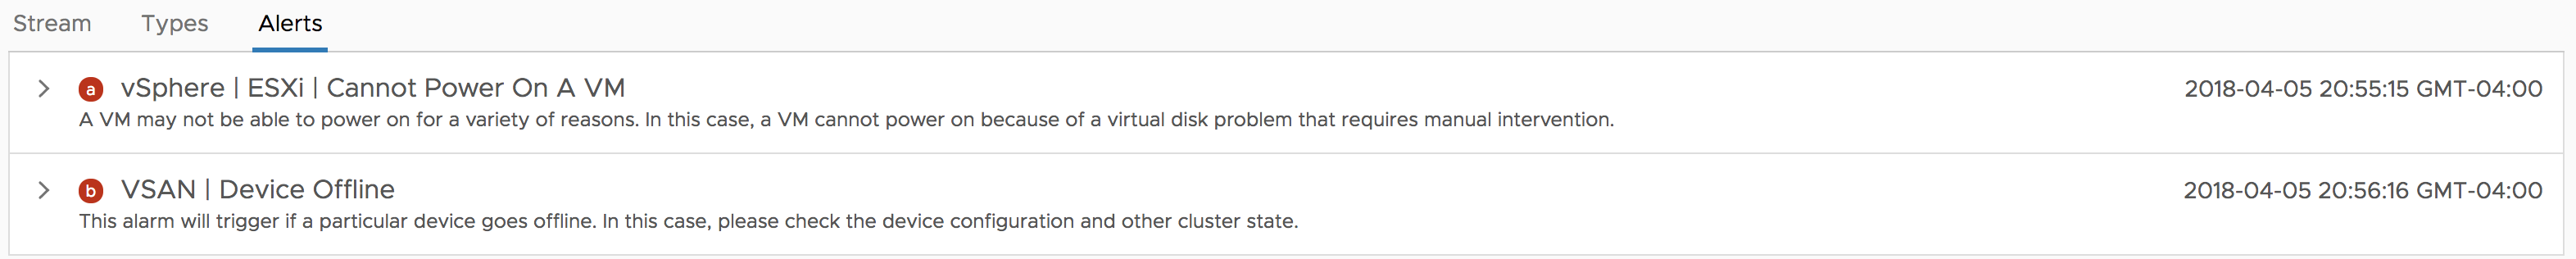
Alerts
Finally, you have the Alerts tab, which should have a timeline of alerts similar to the Recent Alerts page:
Event Options
Going back to the Streams tab, for every event, you also have other options:
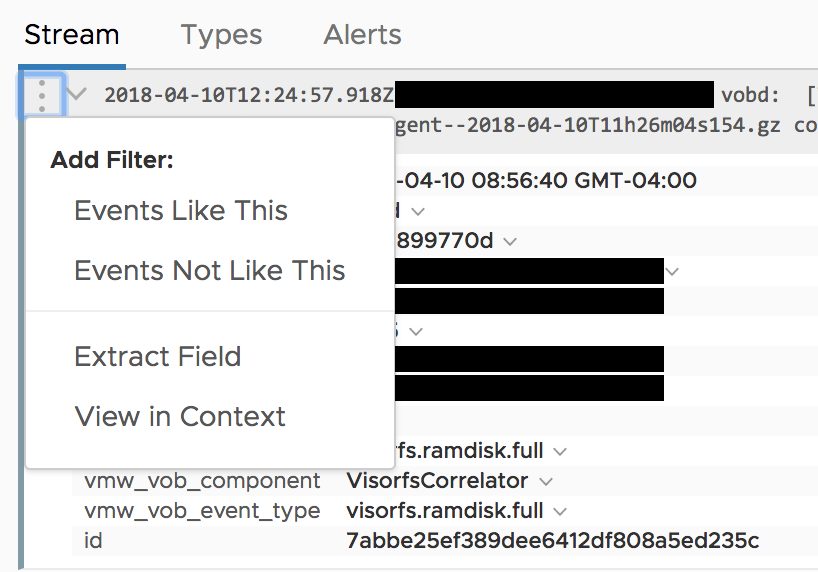
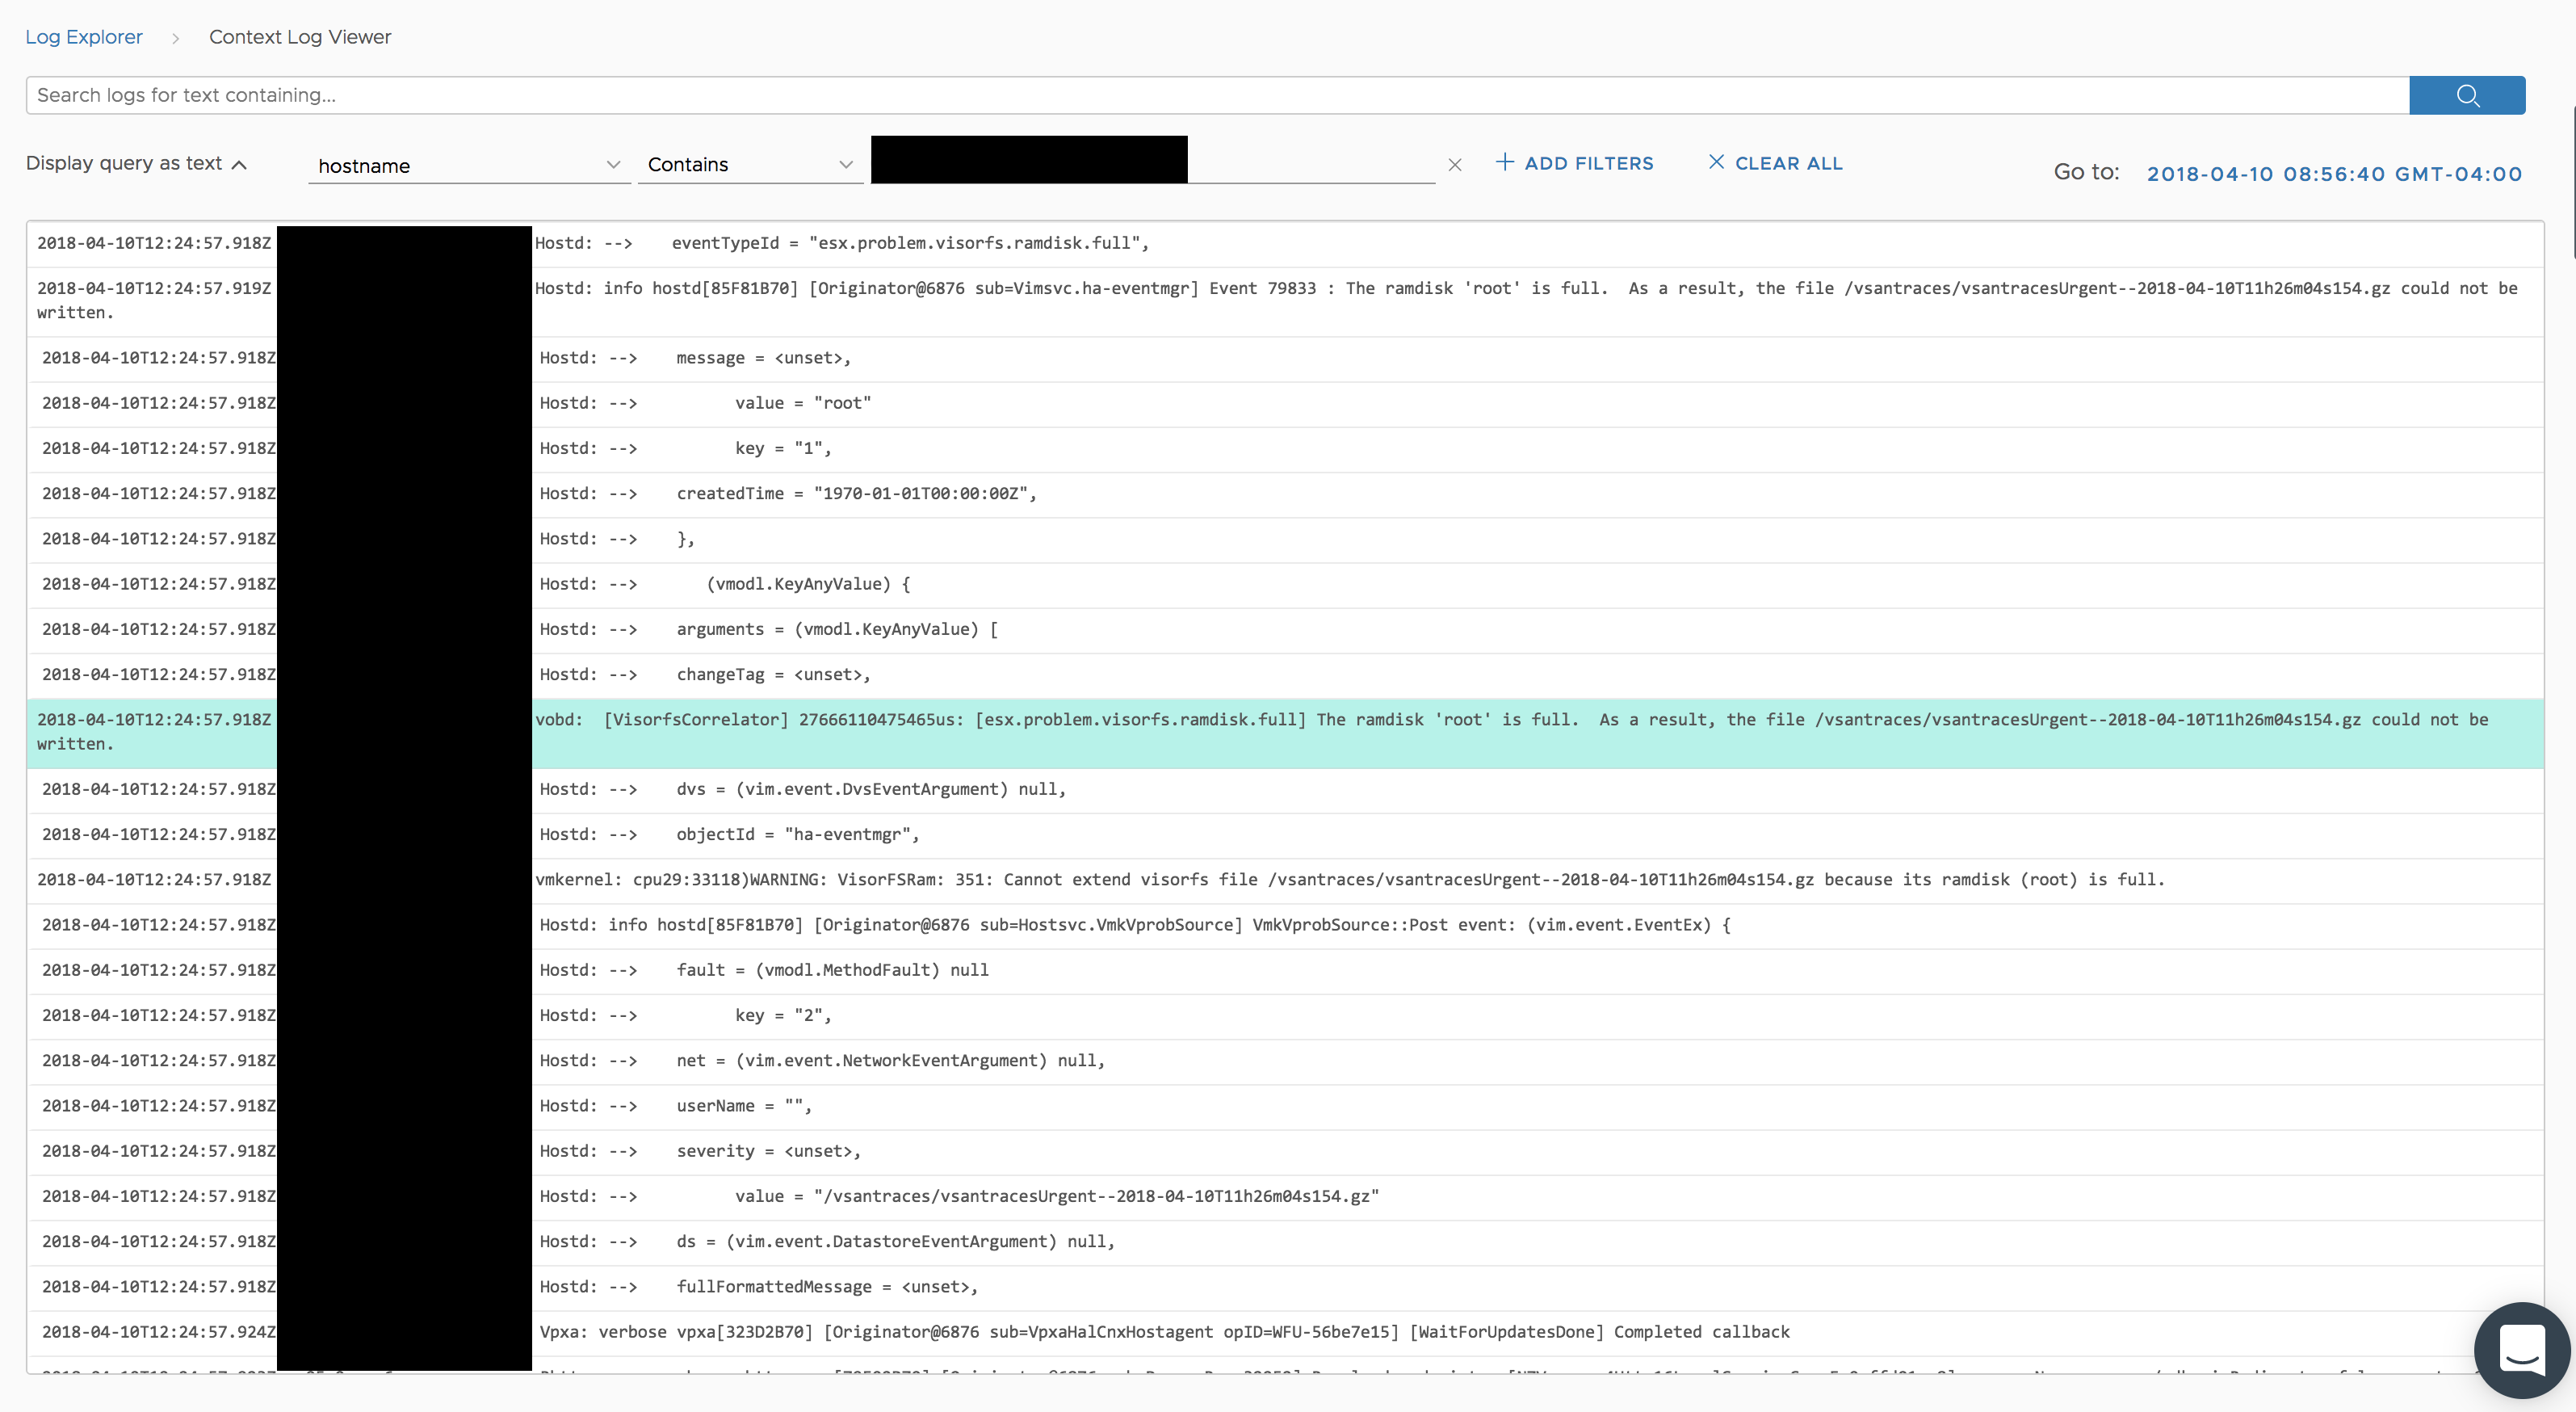
View in Context
View in Context shows you the event you pivoted on and the events that happened before as well as after that event. By default, the hostname and/or filepath fields are added to the query (if available) though the context query can be changed as desired. (Note: This is all like Log Insight except the hostname and/or filepath fields being added to the query)
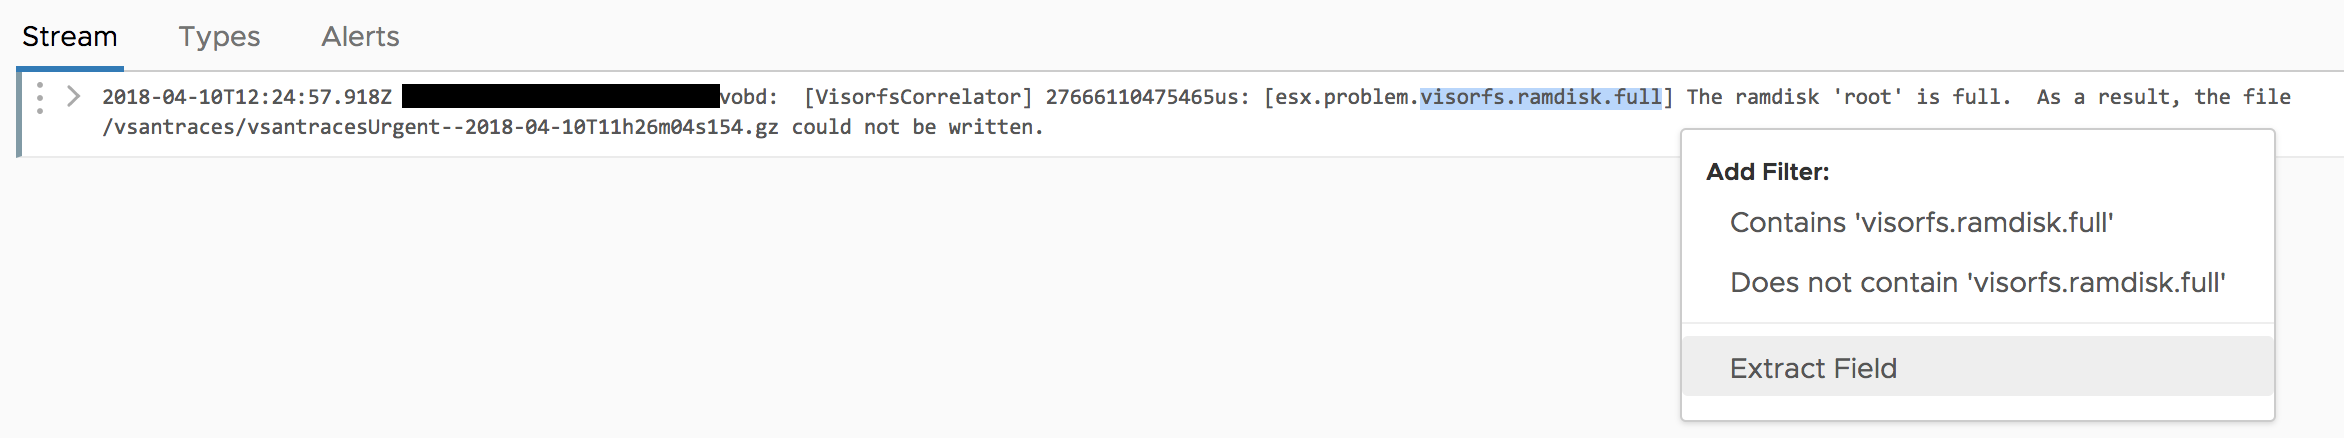
Extract Field
You also have the ability to create your own extracted fields. You can do this in various ways, including from the event other options menu or by selecting part of an event and selecting Extract Field.
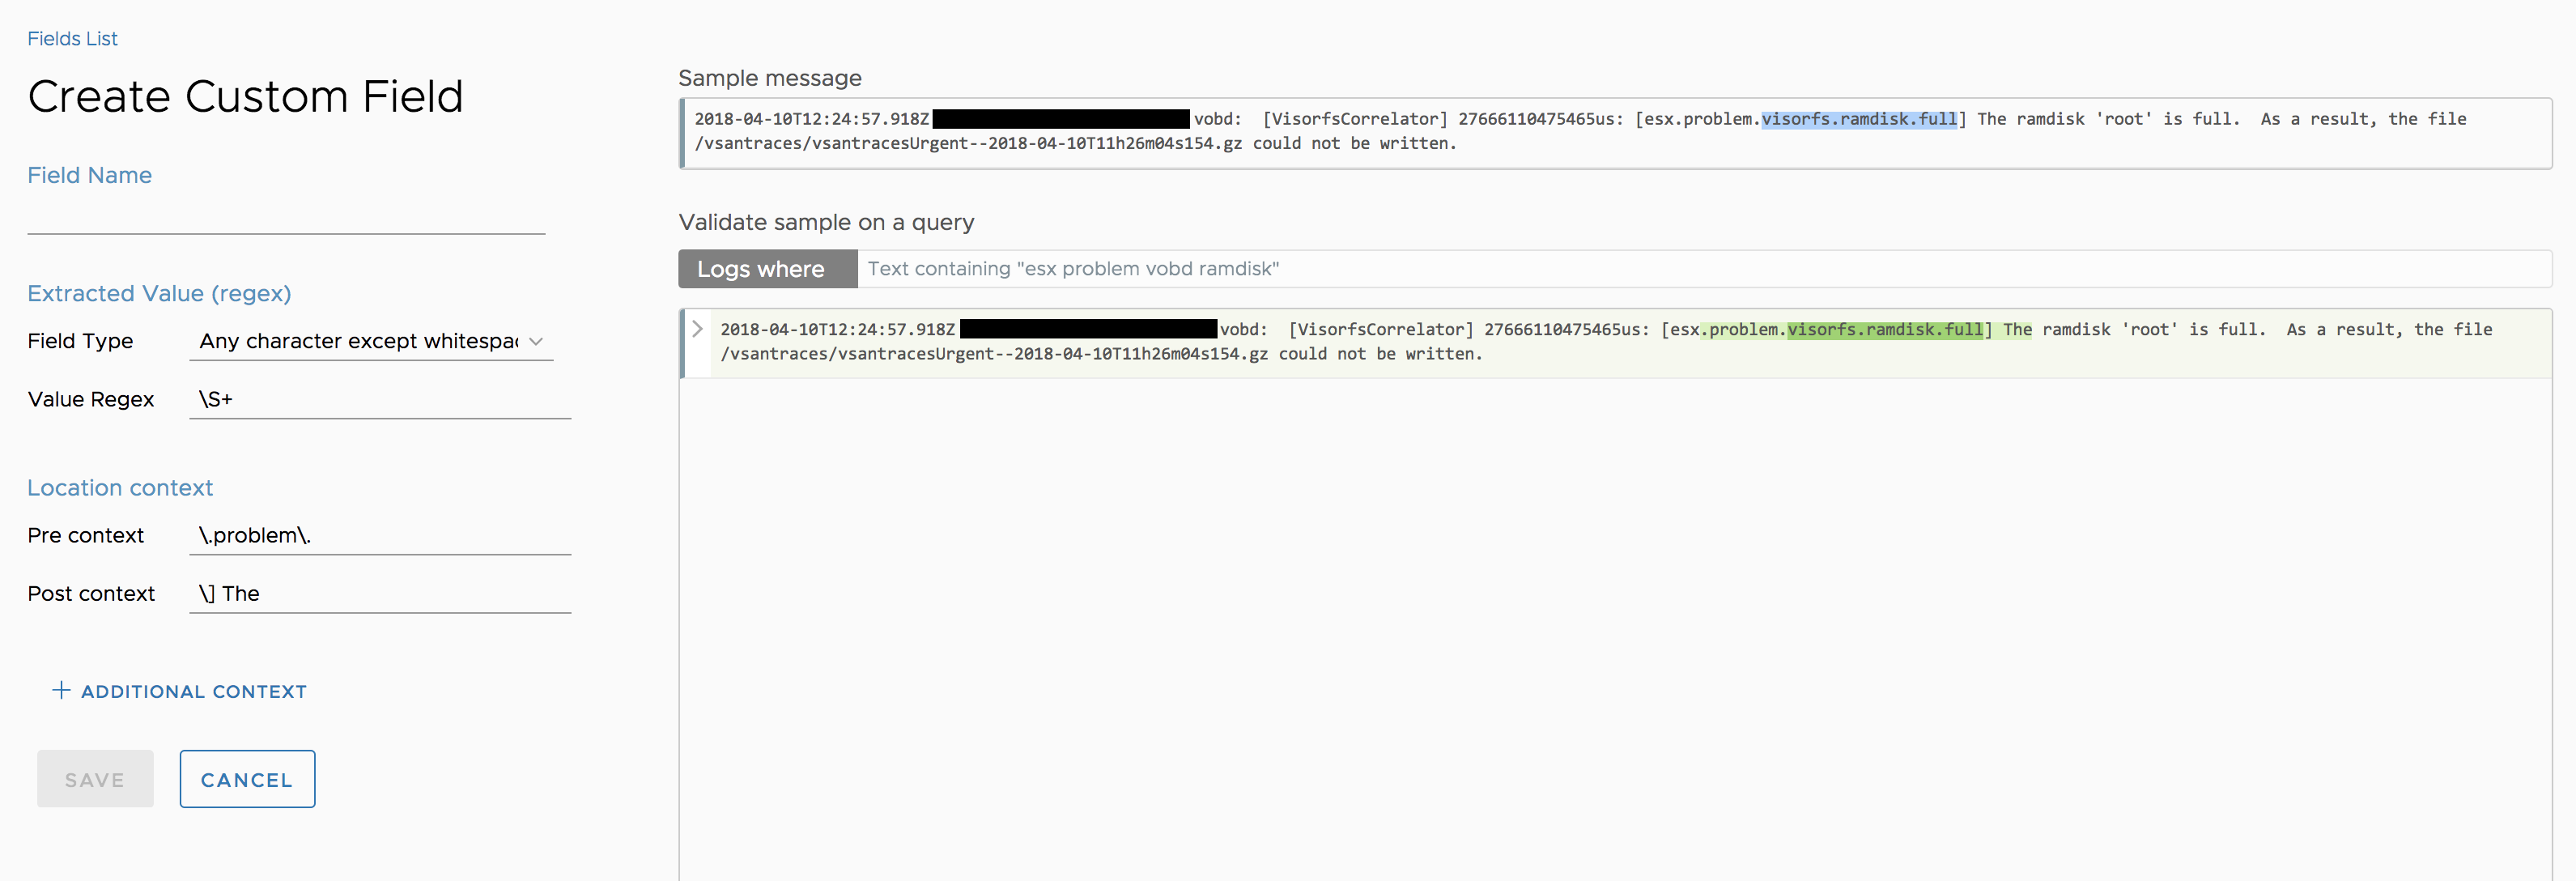
Doing this brings you to the Create Customer Field wizard, where Log Intelligence attempts to create the field definition for you. At a minimum, you must enter a unique name for the field.
IMPORTANT: The name must be unique
In addition, you can modify the field definition as desired, including adding additional context to optimize the query better:
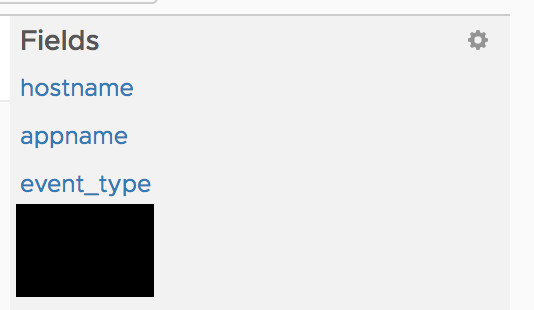
Fields
To the right of the events is the Fields panel. This lists all the fields for the result set of the given query:
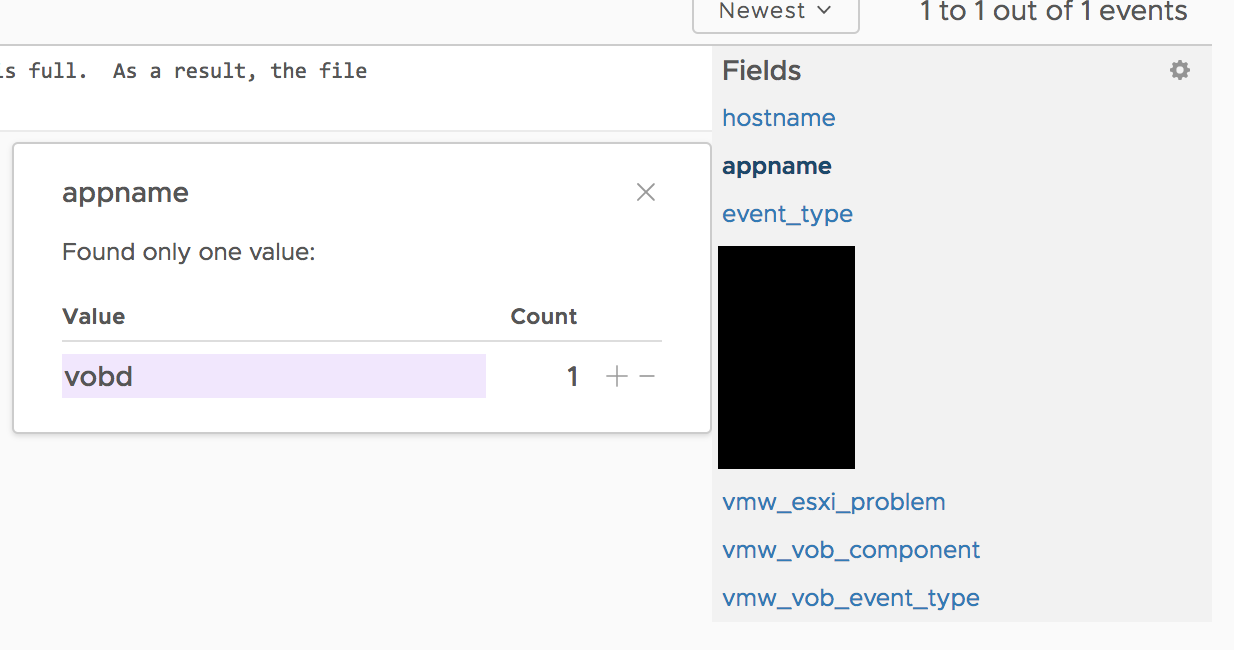
You can select any of the fields in the panel to see the values available for the given field, as well as add/remove values from the given query:
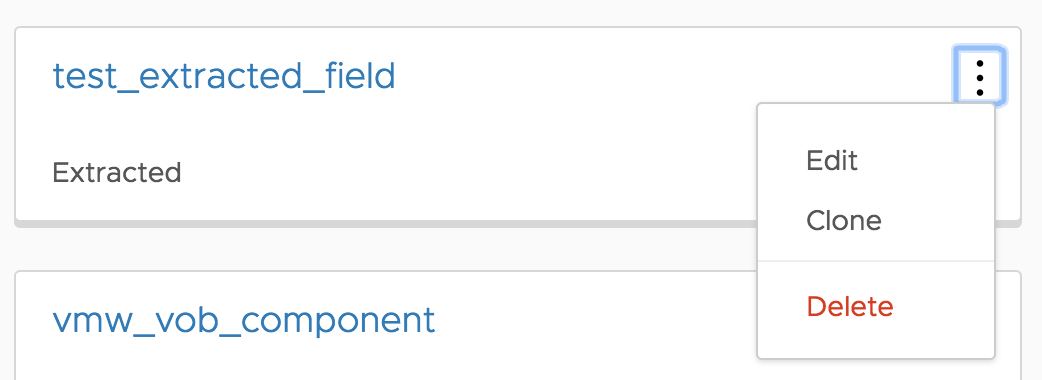
In addition, you can select the gear icon in the Fields panel to see all fields in the system and modify those that can be modified:
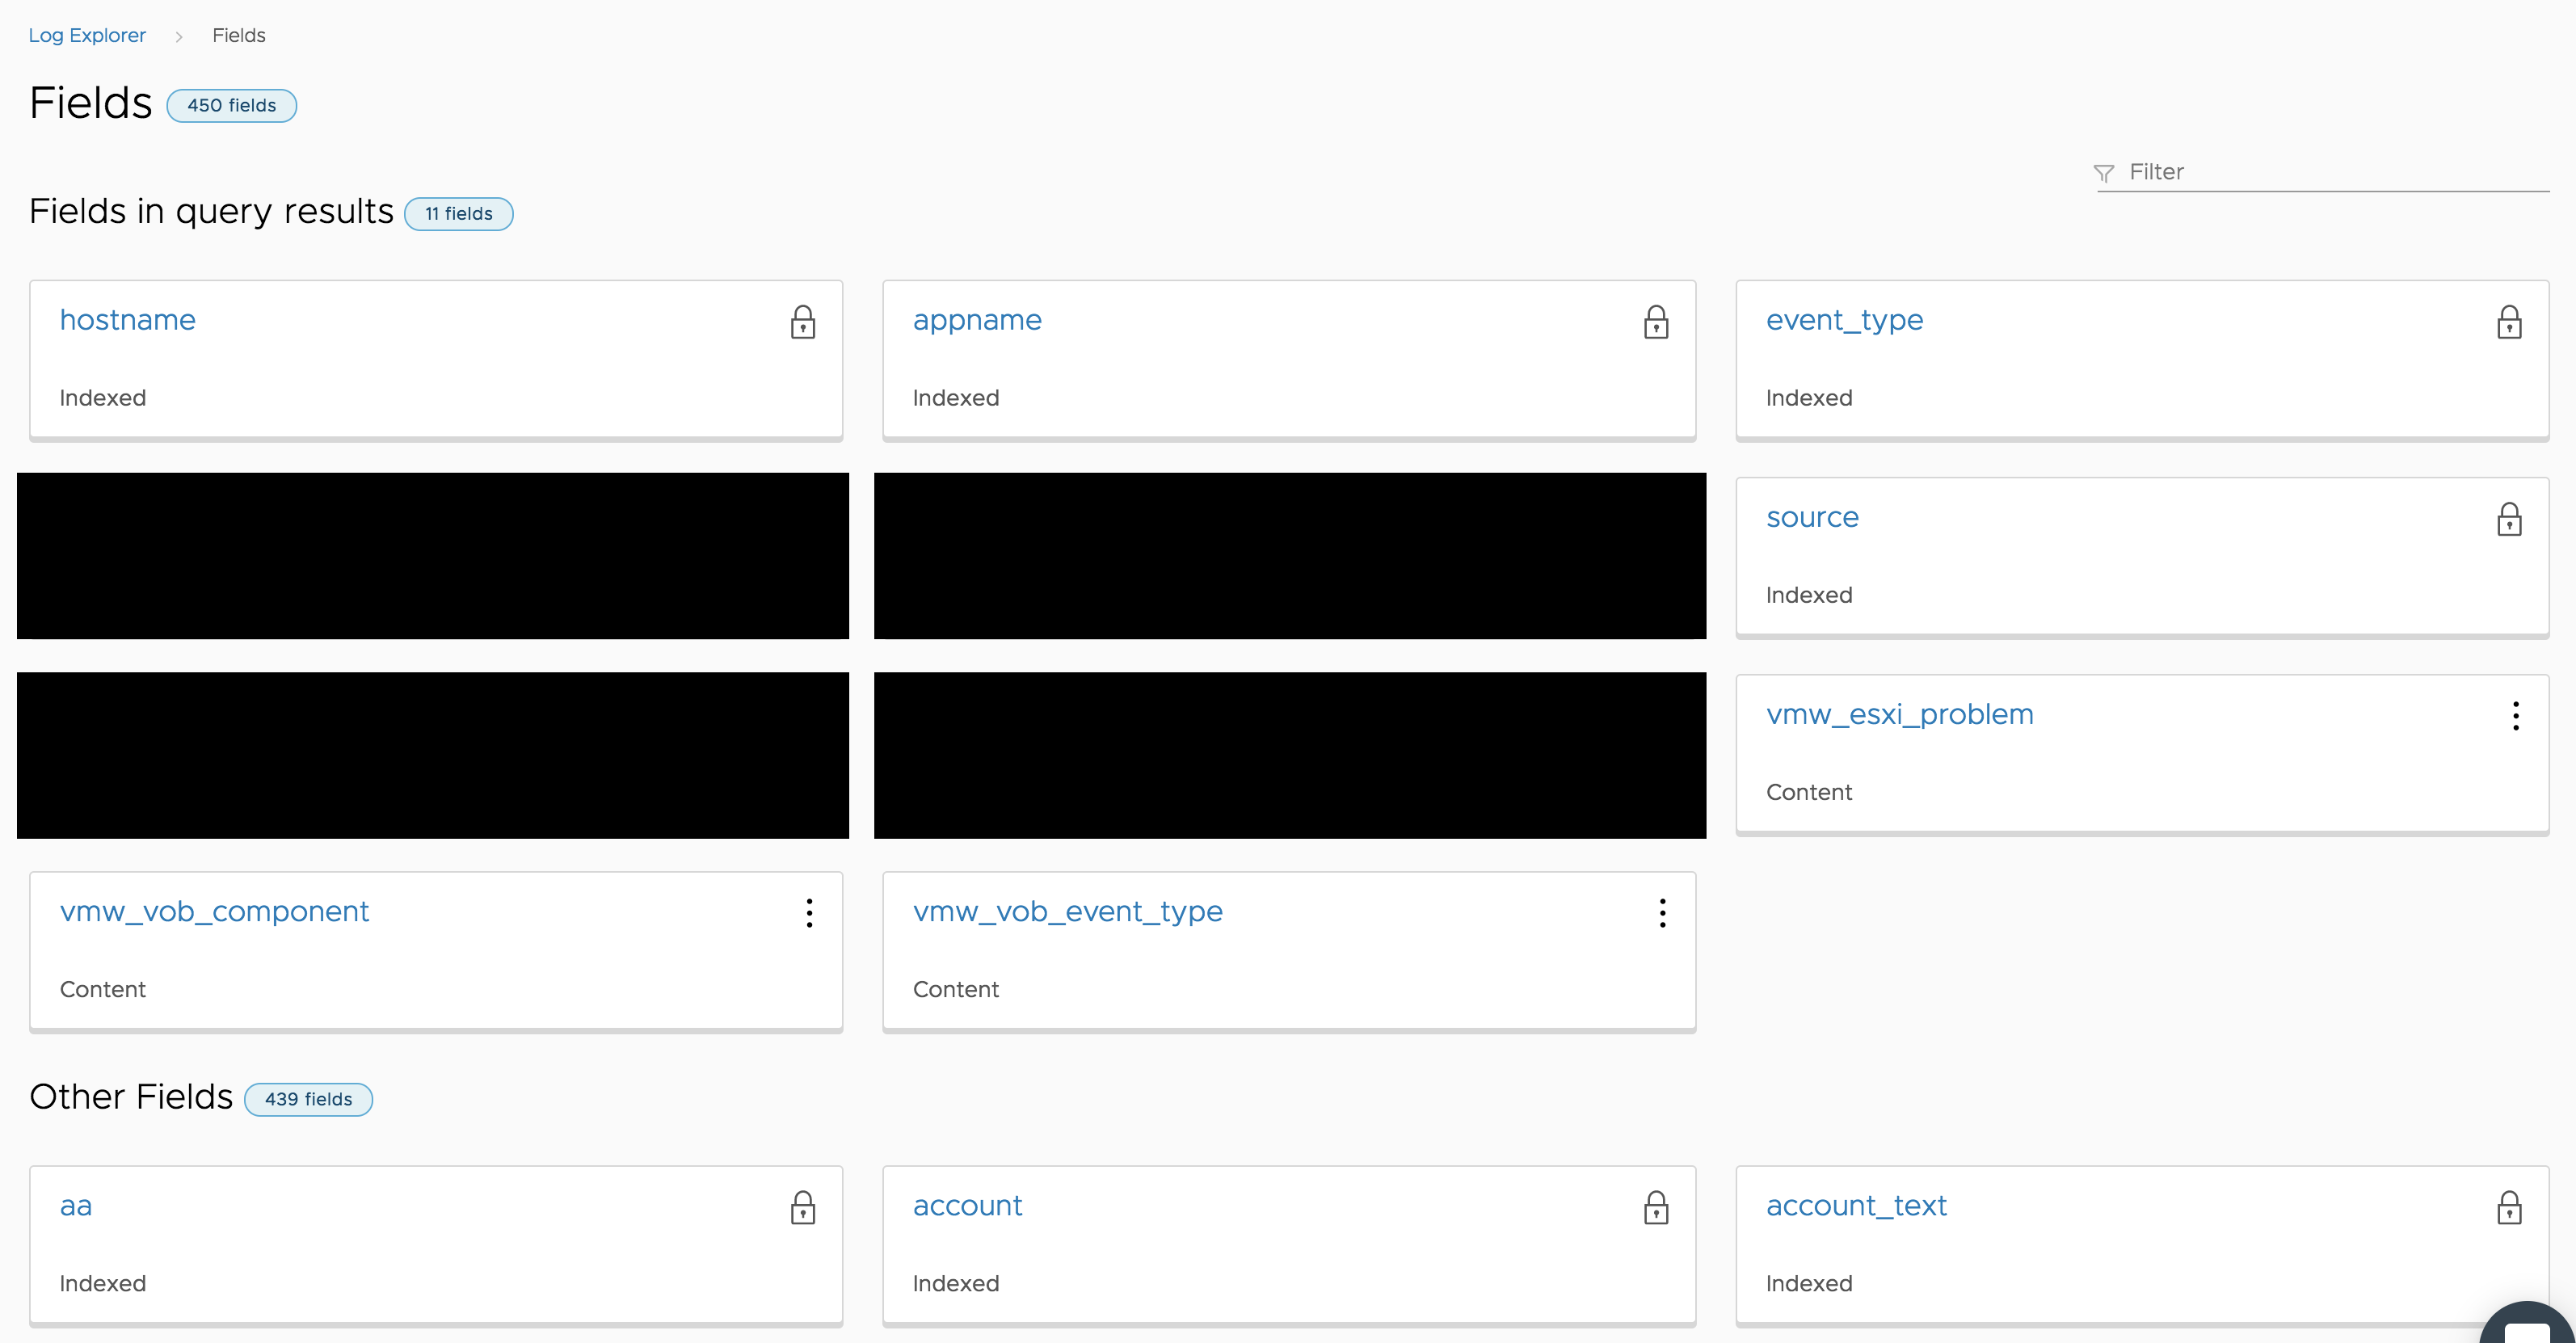
You will notice three different types of fields in Log Intelligence:
- Indexed — discovered during ingestion and cannot be modified (thus the lock icon)
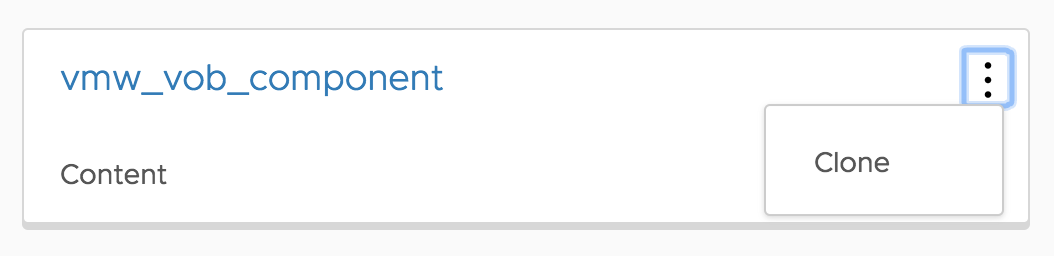
- Content — statically (today) imported into Log Intelligence and behave like extracted fields, but can only be cloned
- Extracted — query time regular expression defined by the user; can be edited, cloned, or deleted
IMPORTANT: What operations you are allowed to do depends on your role. I will cover roles in a future post.
Summary
Whew, that was a lot of material for one post! As you can see, the Explore page provides a ton of functionality. With it, you should be able to troubleshoot your environment and get to root cause analysis easily. What do you think of the Explore page?
© 2018 – 2021, Steve Flanders. All rights reserved.