
I recently talked about Prometheus. In this post, I would like to dig into querying in Prometheus. Read on to learn more!

UI
When you first log into the Prometheus UI, this is what you are presented with:
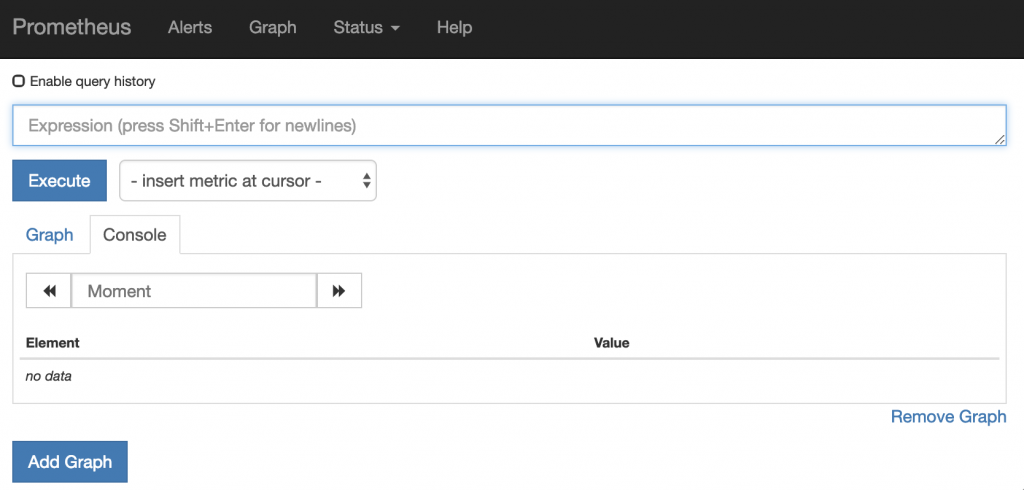
You start by either beginning to enter your query or selecting the drop-down and picking a metric. The question becomes, how do you construct a query if you have never used Prometheus before?
Metric Name
In general, you start with a metric name. The good news is that the query box provides auto-completion for metric names. The general naming convention for a metric name is <service>-<metric>-<unit>. For example, let’s assume you are scraping JVM metrics. You will see metrics like the following:
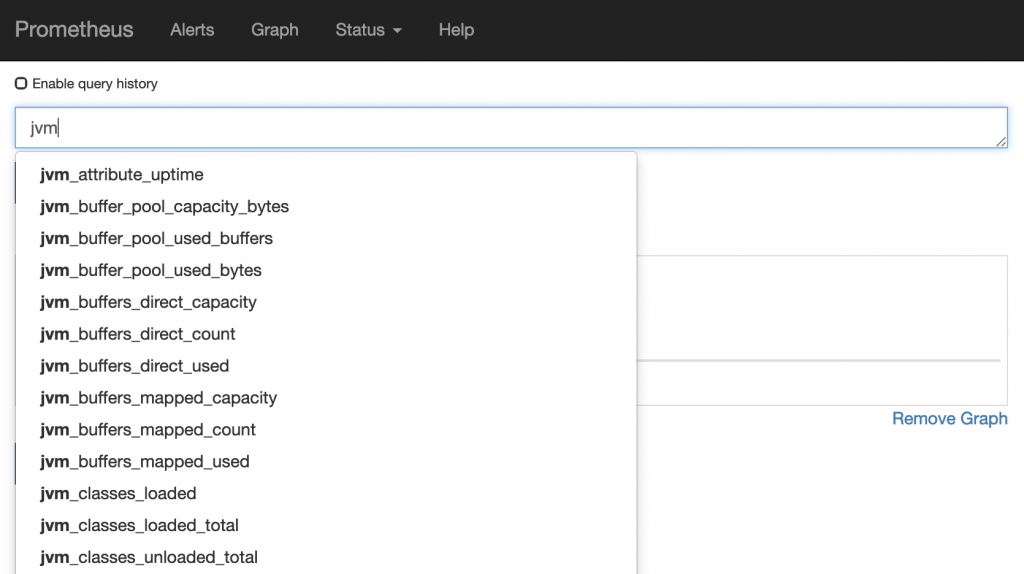
The best part is that the auto-complete works for any part of the metric name (not just the beginning). So just start typing in what you are looking for. No idea what you are looking for? Take a look at the metrics documentation for the service you care about or load the metrics UI for the service to see what it is exposing.
Results
OK, you found a metric you want to look at, now what? Run execute to see the results for that metric:
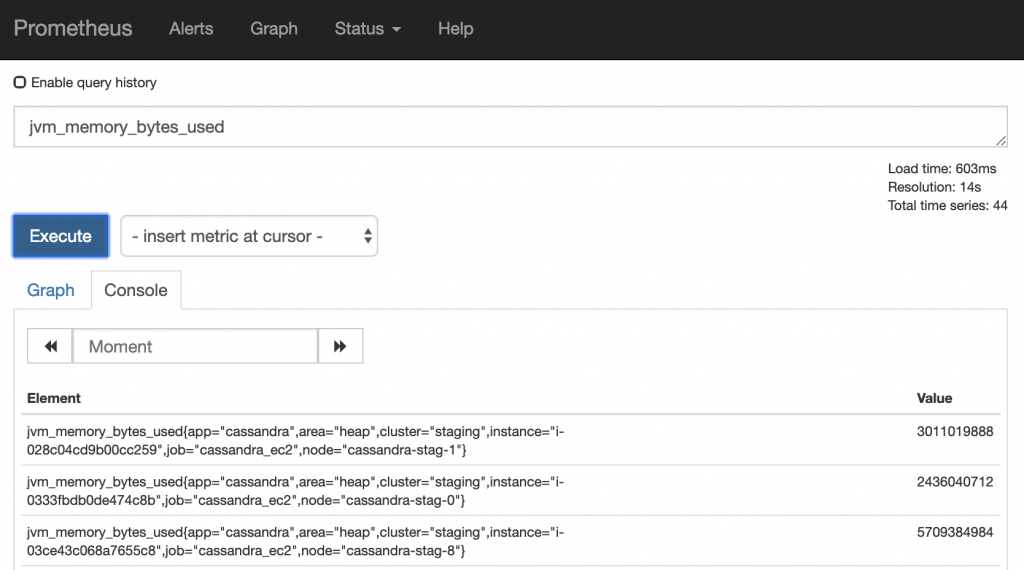
What you are presented with is the current result for that metric based on every endpoint for which that metric was found. You will notice after the metric
Aggregation
Now that we have a metric and its value, we can apply one or more functions on the metric. For example, if we want to see the rate of change for the above metric we could do:
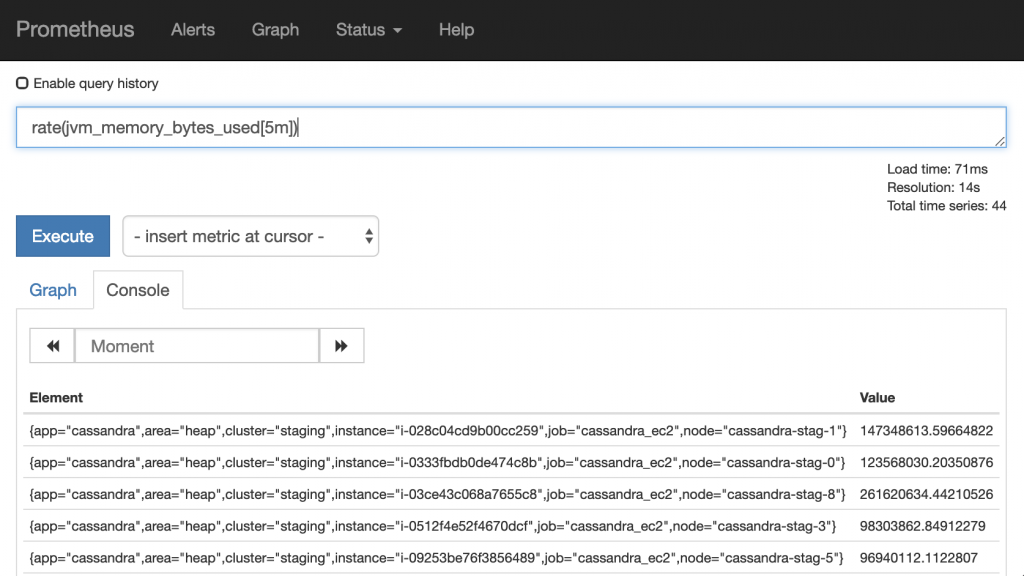
We now see the rate of this metric over the last 5 minutes. Many functions exist in Prometheus.
Groupings
We can also group metric or functions together using the labels. For example:
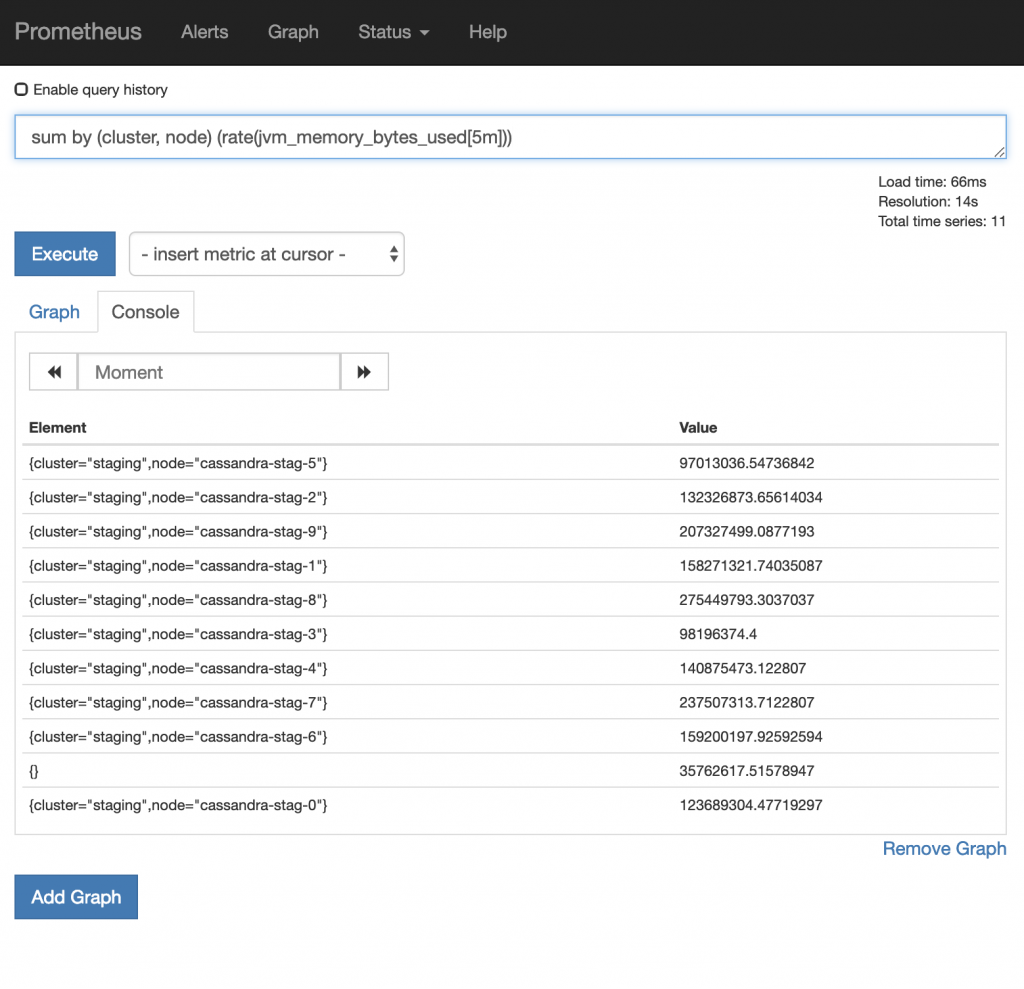
As you can see, we are now grouping by cluster and node. When doing this, only the labels specified are shown. Alternatively, you can change the by to without to exclude labels from being shown.
Filtering
In the above example, you will notice that one of the results does not contain the cluster or node labels. You can exclude these results from being seen via filtering. For example:
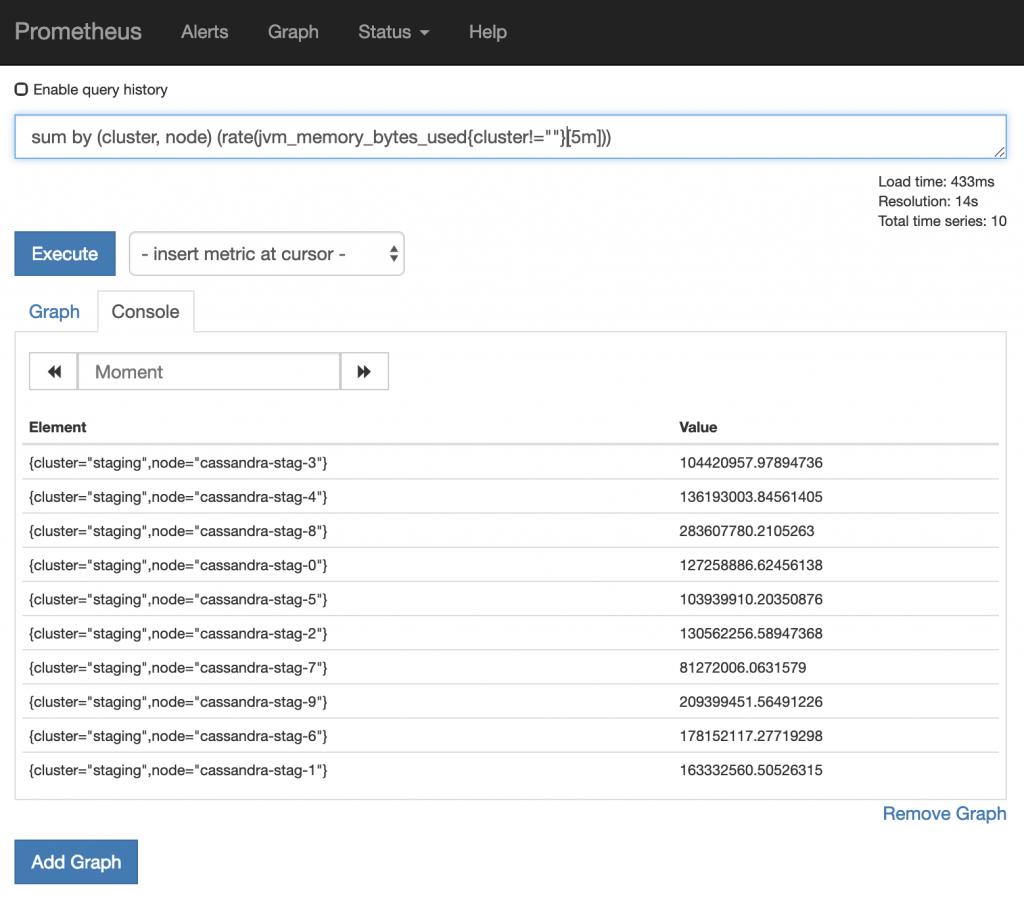
Here we are saying do not show metrics that do not contain a cluster label. A variety of operators exist that can be used to filter.
Advanced Querying
With the above information you can construct some powerful queries, but over time you will want to do even more. Let’s use a more advanced query to demonstrate what is possible:sum by(namespace, pod) (delta(kube_pod_container_status_restarts_total{pod=~"^cassandra.*"}[10m]) > 0) and on(pod) (label_join(up offset 20m, "pod", ",", "kubernetes_pod_name") == 1)
OK, so what is happening here? Let’s break it down:
- We are looking for the
deltaof thekube_pod_container_status_restarts_totalmetric over the last 10 minutes where thepodlabel starts withcassandra - In addition, we want to map the
podfound in thekube_pod_container_status_restarts_totoaltokubernetes_pod_nameand check whether theupmetric for it is equal to one - For this join, show the value of the
kube_pod_container_status_restarts_totalmetric with thenamespaceandpodlabels
Whoa. Now you may be wondering why you would ever need to construct such a query. Here is a scenario: in your k8s cluster, you have cronjobs or jobs that run, which may restart (either intentional or not), but for which they will auto recover. In this scenario, you do not want to alert on such pods. The above query allows you to eliminate this noise.
Let’s do one more:
sum by (namespace, pod_name) (container_memory_usage_bytes) / sum by (namespace, pod_name) (label_replace(kube_pod_container_resource_limits_memory_bytes, "pod_name", "$1", "pod", "(.*)")) * 100 > 90
OK, so what is happening here? Let’s break it down:
- We want to
sumthecontainer_memory_usage_bytes metricand group bynamespaceandpod_name - We want to divide that values by the
kube_pod_container_resource_limits_memory_bytesmetric - And we want to know when the result is greater than 90%
On the surface, this seems pretty straightforward, so why the label_replace function call? The answer is because the kube_pod_container_resource_limits_memory_bytes metric does not have a label called pod_name (it has a label called pod). This is an issue because the numerator and denominator must group by the same labels. We could update the label sent from the metric to overcome this, but this would require changes and only impact new metrics. Alternatively, we can use the label_replace function to add a temporary label to the kube_pod_container_resource_limits_memory_bytes metric that matches what is included in the container_memory_usage_bytes metric. This allows us to compute the value we desire and determine if we have any pods using greater than 90% of their provisioned memory limit.
Summary
Prometheus is a powerful tool with a powerful query language. It will take some time to learn the syntax, understand the functions and determine the metrics/labels you have available, but once you do, you will quickly understand what metrics/labels you are missing and better be able to observe your microservices.
© 2019 – 2021, Steve Flanders. All rights reserved.